11 Best DevOps & Monitoring Dashboard Templates 2026
DevOps teams live in dashboards. Whether you’re monitoring server uptime, tracking CI/CD pipelines, or debugging production incidents at 3am, the right monitoring dashboard is the difference between a quick fix and a long night.
But “DevOps dashboard” covers two very different things, and most roundups quietly mix them up. Monitoring platforms — Grafana, Netdata, Uptime Kuma — are backends. They scrape metrics, store them, and hand you a fixed UI to look at them through. That is exactly what you want when you need to watch your own infrastructure. Dashboard templates are the other half: real front-end source code you own, that you point at whatever backend you already run. That is what you need when you’re building something — an internal ops console, a customer-facing status product, a monitoring portal for a client — because a platform’s UI is not yours to restyle, rebrand, or ship.
So this guide is split. Number one is the DevOps dashboard template we’d hand any team building a monitoring UI from scratch. The remaining ten are the best self-hostable monitoring platforms to run behind it — every one open-source, actively maintained, and battle-tested in production.
DevOps Dashboards at a Glance
Short on time? Here’s how the eleven stack up before you dig into the full reviews.
| Name | Type | License | Best for |
|---|---|---|---|
| Signal Dashboard | Dashboard template | From $69 · full source | Building your own DevOps UI or status product |
| Uptime Kuma | Monitoring platform | Free · MIT | Uptime and endpoint checks |
| Netdata | Monitoring platform | Free · GPL-3.0 | Zero-config real-time server metrics |
| Grafana | Visualization platform | Free · AGPL-3.0 | Custom dashboards over any data source |
| Portainer | Management UI | Free · Zlib | Docker and Kubernetes administration |
| SigNoz | Observability platform | Free · MIT | Logs, metrics and traces in one place |
| OpenObserve | Observability platform | Free · AGPL-3.0 | High-volume logs on a small budget |
| Checkmate | Monitoring platform | Free · AGPL-3.0 | Uptime plus server hardware health |
| Woodpecker CI | CI/CD engine | Free · Apache 2.0 | Self-hosted pipelines without Jenkins |
| Cachet | Status page app | Free · BSD-3-Clause | Public status pages |
| Grafana K8s Dashboards | Dashboard JSON pack | Free · Apache 2.0 | Kubernetes cluster monitoring |
Quick Picks
- Best DevOps dashboard template: Signal Dashboard — 50+ pages of DevOps UI source you own, from incidents to Kubernetes to cloud costs
- Best overall monitoring platform: Grafana — 73k stars, connects to 100+ data sources, industry standard
- Best zero-config monitoring: Netdata — 76k stars, real-time metrics with zero configuration
- Best uptime monitoring: Uptime Kuma — 84k stars, beautiful self-hosted alternative to Uptime Robot
- Best Datadog alternative: SigNoz — 26k stars, unified logs/metrics/traces on OpenTelemetry
- Best status page: Cachet — 14k stars, self-hosted Statuspage.io alternative
1. Signal Dashboard
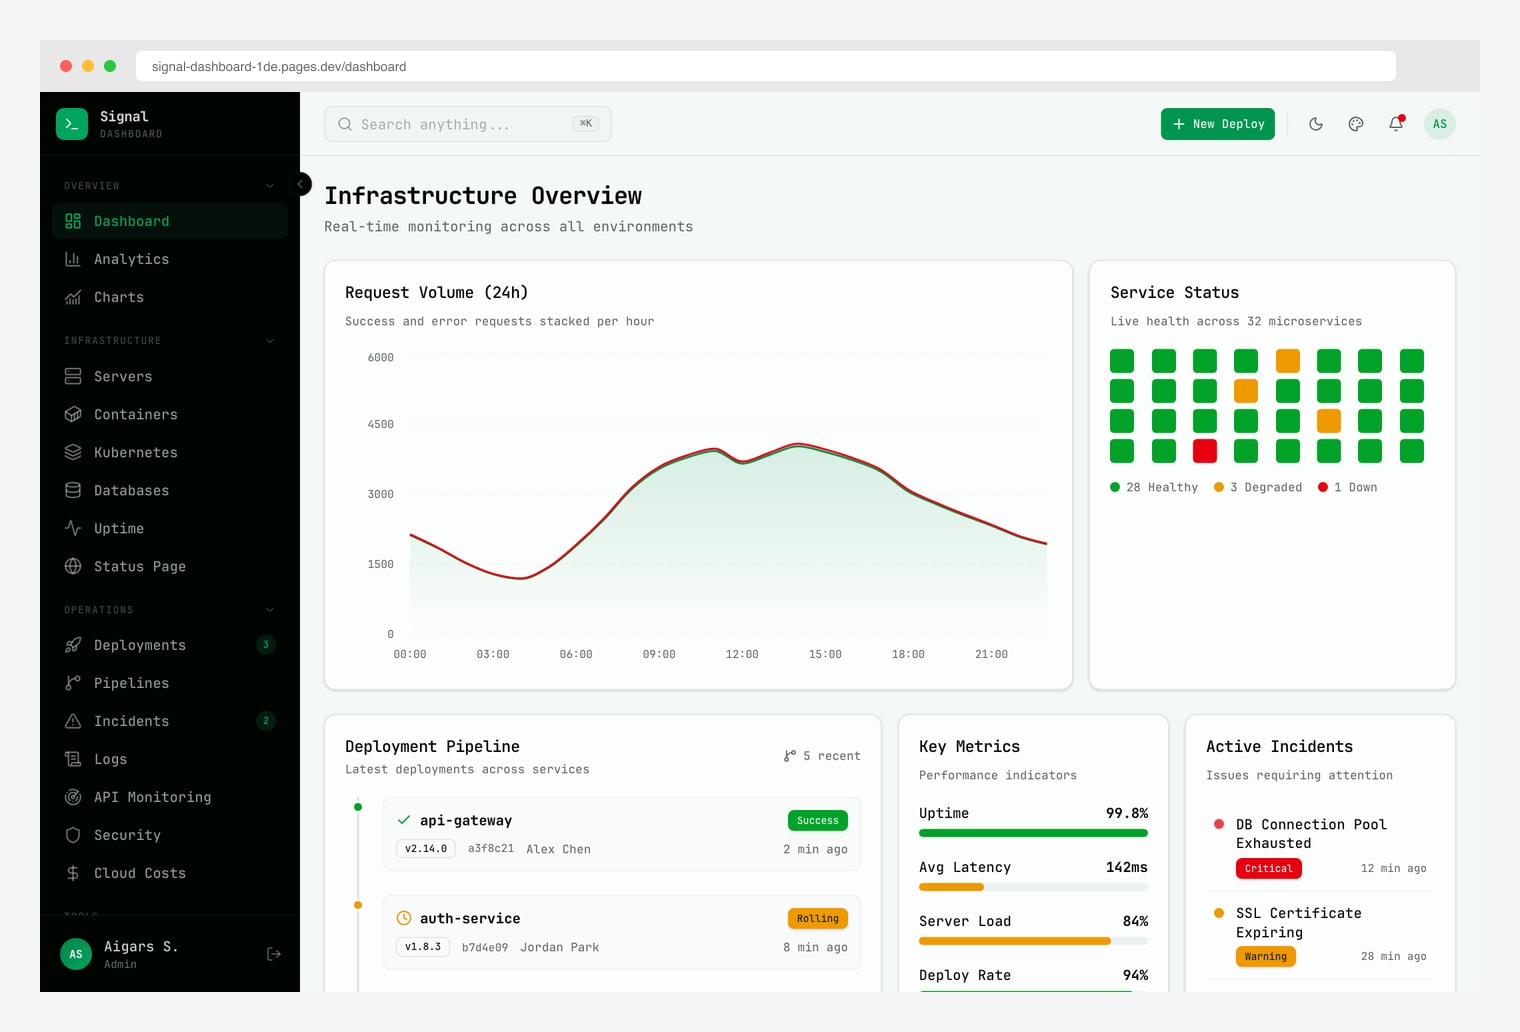
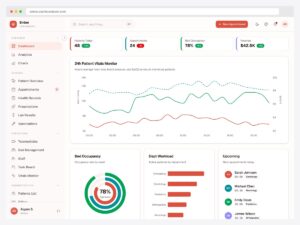
Why we like it: Signal is a dashboard template rather than a monitoring platform — 50+ pages of Next.js source you own. Sixteen are infrastructure-specific: Servers, Containers, Kubernetes, Databases, Uptime, Status Page, Deployments, Pipelines, Incidents, Logs, API Monitoring, Security, Cloud Costs, On-Call Schedule, Alerts, and Team/RBAC.
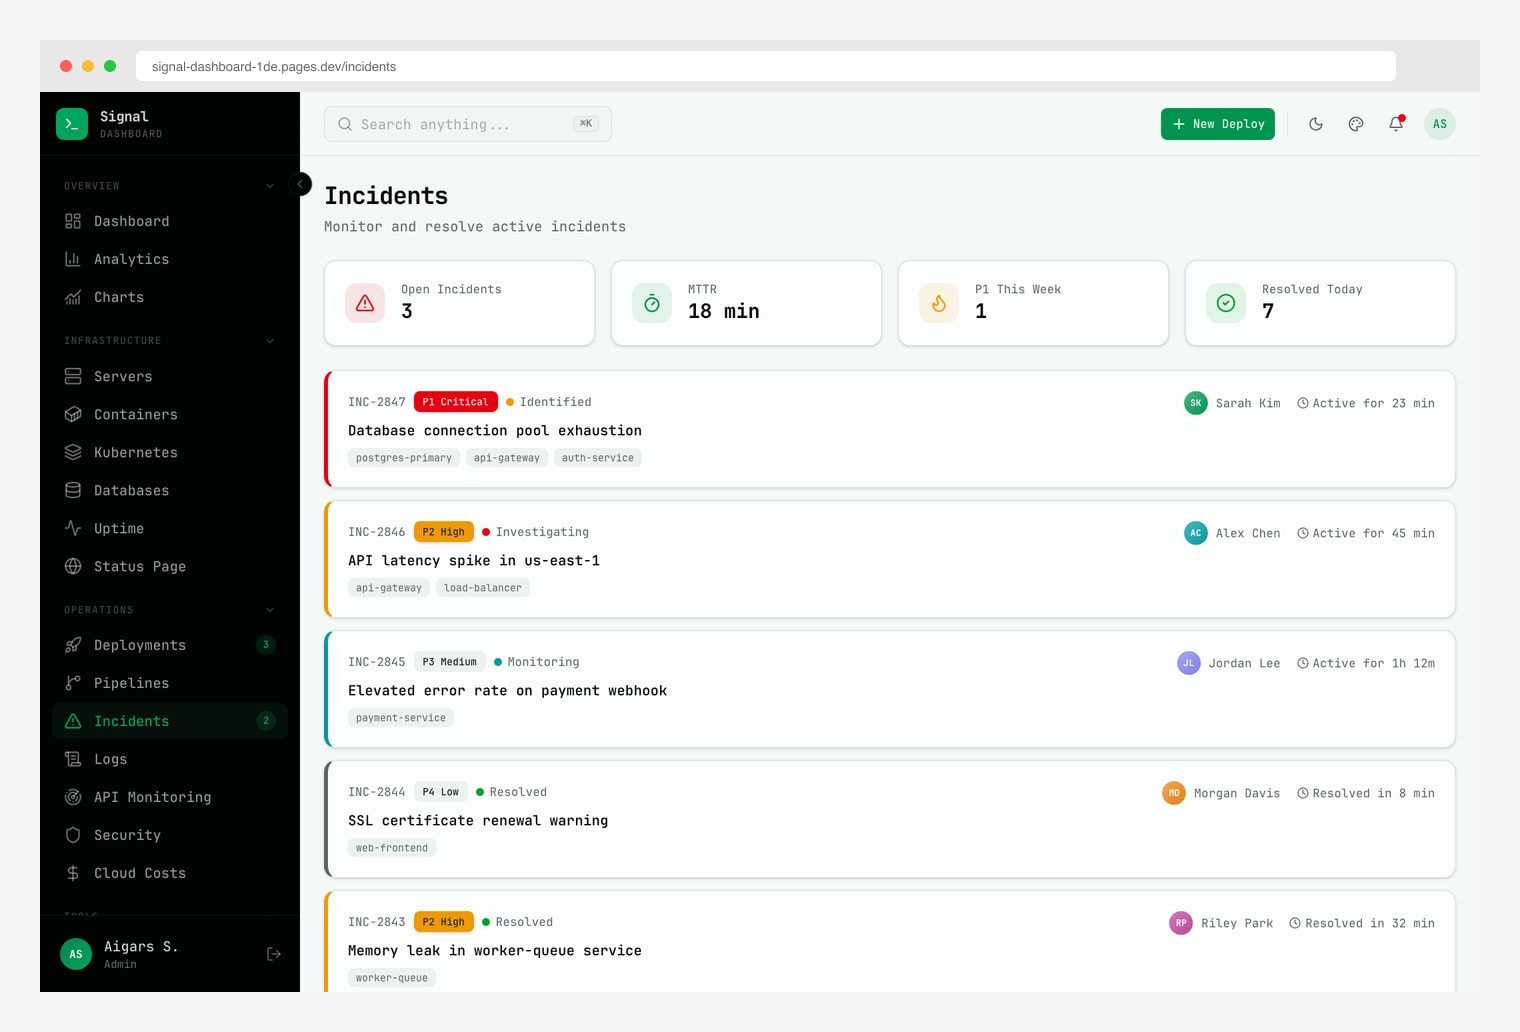
The Infrastructure Overview covers request volume, service health, deployment status, and open incidents. Incidents tracks severity (P1–P4), status, affected services, assignee, and MTTR. Uptime gives 30-day per-service timelines with response times, and Status Page publishes the same data. Also included: Kubernetes views for clusters, nodes, namespaces and pods; Cloud Costs across AWS, GCP and Azure; API Monitoring with p95/p99 latency; a Security page for CVEs; log streaming; and an on-call calendar.
It is built on Next.js 16, React 19, TypeScript, Tailwind CSS v4 and shadcn/ui, with Recharts for charts. The shell adds a Cmd+K command palette, dark/light themes, three layout modes, RTL, and i18n for English, German and French. Vitest unit tests, Playwright end-to-end tests, Storybook, and a CI workflow are included, along with a seed/ starter project and a built-in /docs site. Pricing is $69 for a single project, $149 developer, $349 lifetime, with full source.
2. Uptime Kuma
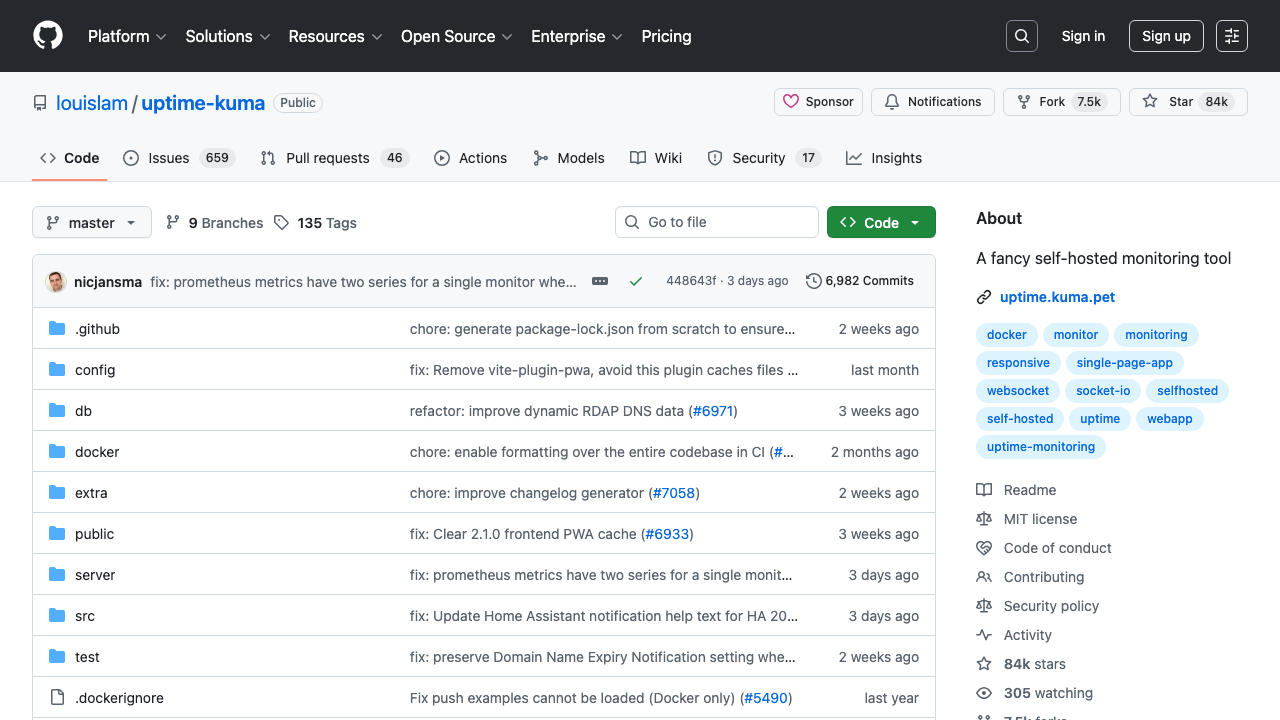
Why we like it: With 84k GitHub stars, Uptime Kuma is the most popular self-hosted monitoring tool on GitHub. The clean, modern UI monitors HTTP(s), TCP, Ping, DNS, Docker containers, and more, with 90+ notification integrations (Telegram, Discord, Slack, Email).
Uptime Kuma provides a dashboard showing all your monitored services with real-time status indicators, response time graphs, and uptime percentages. The built-in status page feature lets you create public-facing pages showing your service health — no separate status page tool needed.
Deploy with a single Docker command: docker run -d -p 3001:3001 louislam/uptime-kuma. Add monitors through the web UI, configure notifications, and you’re live in minutes.
The limit is that the UI is the product. You get Uptime Kuma’s look, Uptime Kuma’s information hierarchy, and Uptime Kuma’s status page — which is excellent for your own team and a poor fit if you need uptime views sitting inside your own branded product. That is the case where you run Kuma as the checker and build the front end from Signal’s Uptime and Status Page screens instead.
3. Netdata
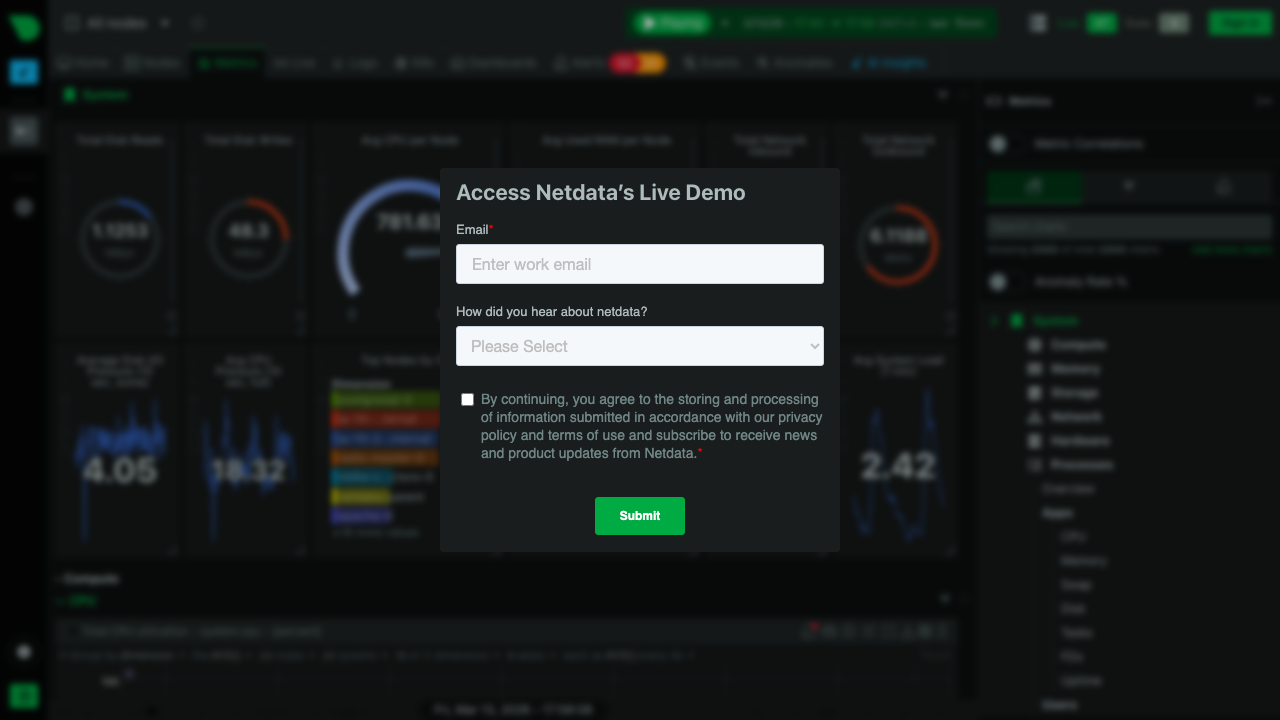
Why we like it: Install Netdata and it immediately starts collecting thousands of metrics per second — CPU, memory, disk, network, applications, containers — with zero configuration. Uses less than 1% CPU and includes built-in ML anomaly detection.
Netdata’s agent auto-discovers running services (MySQL, Nginx, Docker, etc.) and starts collecting metrics immediately. The web dashboard provides interactive, per-second granularity charts that are surprisingly fast to navigate even on modest hardware. The cloud option at app.netdata.cloud aggregates metrics from multiple nodes into a unified view.
At 76k stars, Netdata has one of the largest open-source monitoring communities. The recent addition of ML-based anomaly detection means the dashboard can highlight unusual patterns before they become incidents. Its per-second firehose is also more than most people want to hand a non-engineer, so teams often keep Netdata for deep debugging and surface a small curated set of those metrics — server health, load, capacity — through a dashboard of their own.
4. Grafana
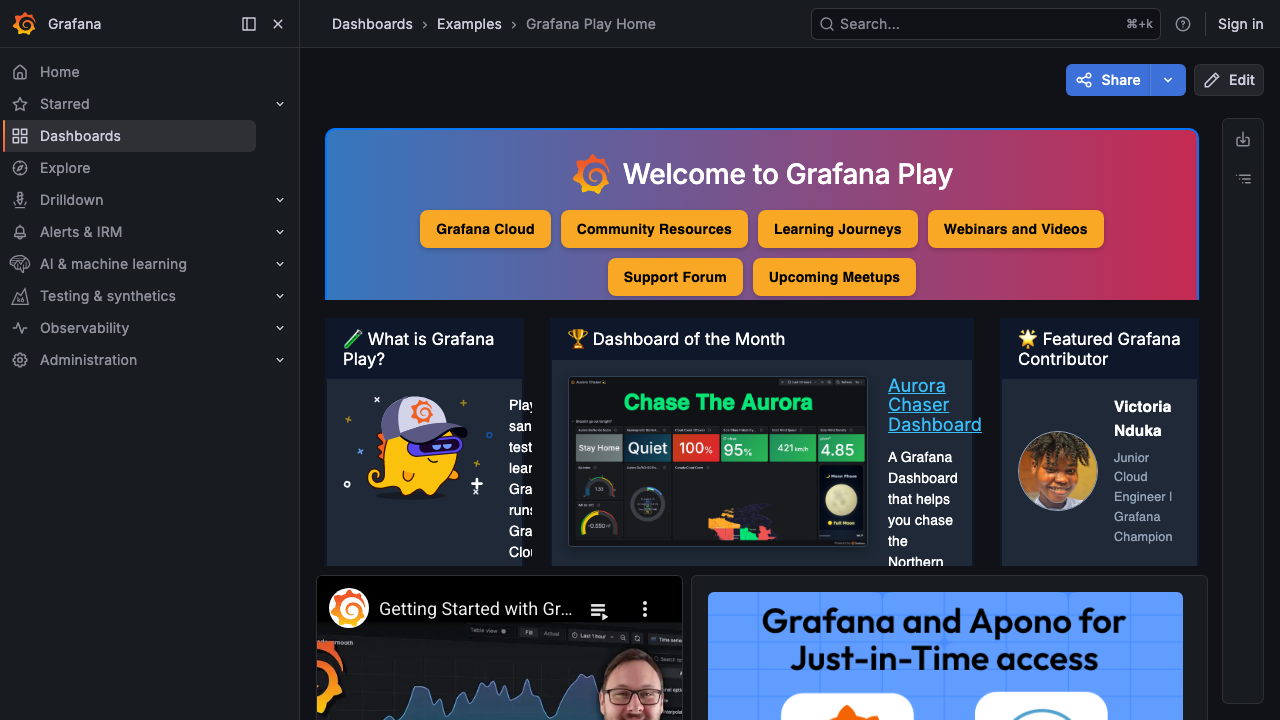
Why we like it: Grafana is the industry standard for monitoring visualization. Connect it to Prometheus, Loki, Elasticsearch, InfluxDB, PostgreSQL, or 100+ other data sources, and build dashboards with the most powerful visualization editor available.
At 73k stars, Grafana is the platform most DevOps teams already know. The real power is in its flexibility — you can visualize anything from infrastructure metrics to business KPIs, from healthcare monitoring to financial reporting, set up alerts based on complex queries, and share dashboards across teams. The community has published thousands of pre-built dashboards you can import.
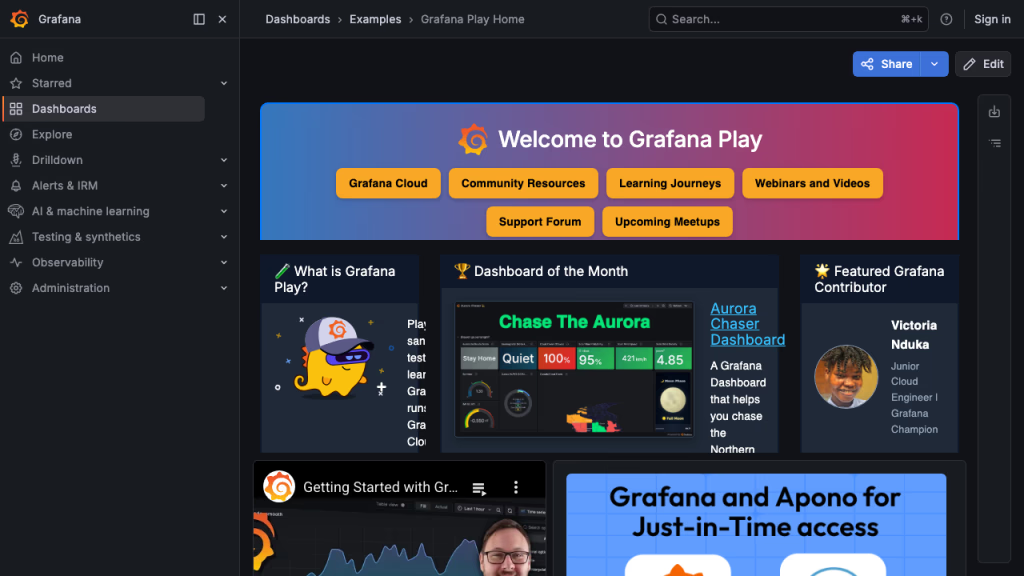
The Grafana Play sandbox at play.grafana.org lets you explore real dashboards without installing anything. For production, pair Grafana with Prometheus for metrics and Loki for logs to build a complete observability stack.
Two things Grafana is not: a front end you can rebrand, and a licence you can ship freely. It is a panel-and-query tool for operators, so product-shaped screens like an incident timeline or an on-call rota are awkward to express in it — and since the 2021 relicence to AGPL-3.0, modifying Grafana and serving it as part of a hosted product obliges you to publish your changes. Most teams therefore keep Grafana as the metrics layer and build the customer-facing views on Signal, querying the same Prometheus behind it.
5. Portainer
Why we like it: Portainer makes container management accessible. Managing Docker containers, images, volumes, networks, and Kubernetes workloads through a clean web UI is dramatically faster than command-line operations, especially for teams that aren’t container experts.
With 37k stars, Portainer is the most deployed container management UI. It supports Docker standalone, Docker Swarm, Kubernetes, and Azure Container Instances. Role-based access control means you can give developers container access without giving them SSH access to your servers.
The free Community Edition covers most use cases. Deploy it alongside your Docker stack and manage everything — from spinning up new containers to viewing logs and resource usage — through the browser. If you’re evaluating dashboard solutions more broadly, our guide on how to choose an admin dashboard template offers a practical decision framework.
6. SigNoz
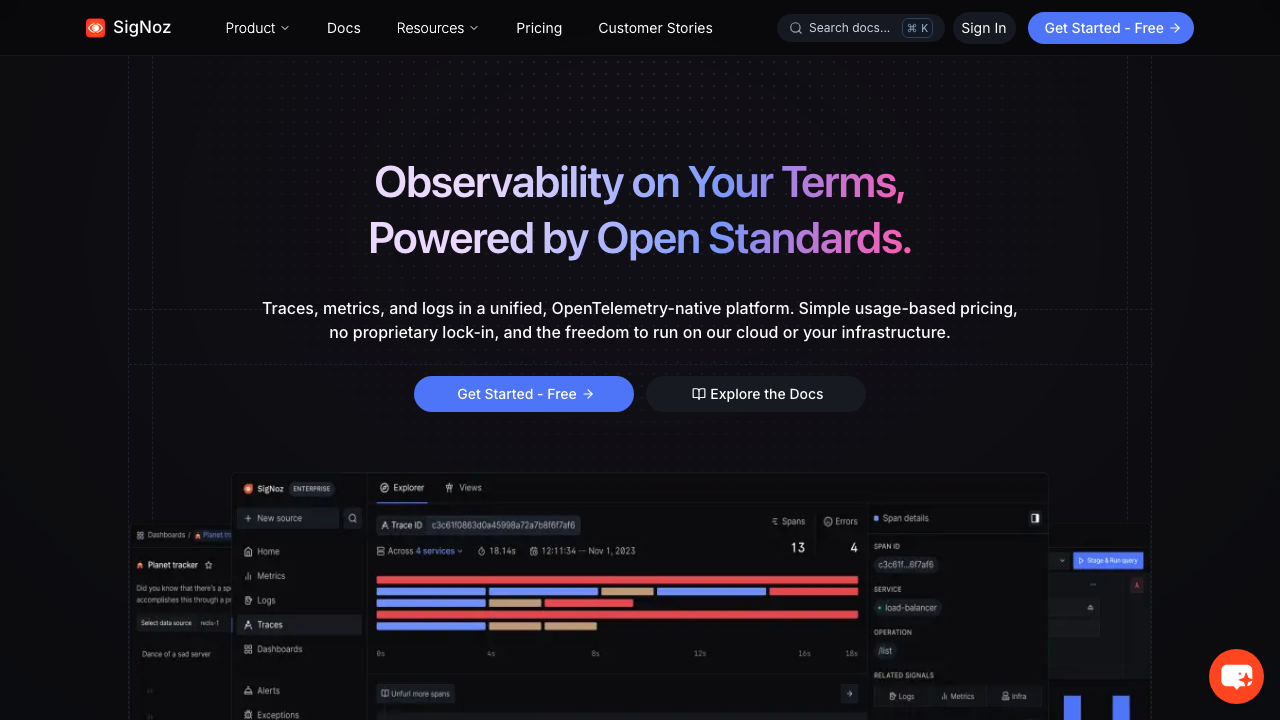
Why we like it: SigNoz provides unified logs, metrics, and traces in a single platform — the same value proposition as Datadog at a fraction of the cost. Built natively on OpenTelemetry, so instrumentation is vendor-neutral from day one.
At 26k stars, SigNoz is growing fast as teams look for alternatives to expensive observability SaaS. The ClickHouse storage backend handles massive data volumes efficiently, and the pre-built dashboard templates for MySQL, MongoDB, JVM, and HTTP APIs get you started quickly.
Features include APM with service maps, distributed tracing, log management, custom dashboards, alerting, and exception tracking. The OpenTelemetry-native approach means switching away from SigNoz later doesn’t require re-instrumenting your code — and, for the same reason, it makes a clean data source for a front end of your own.
7. OpenObserve
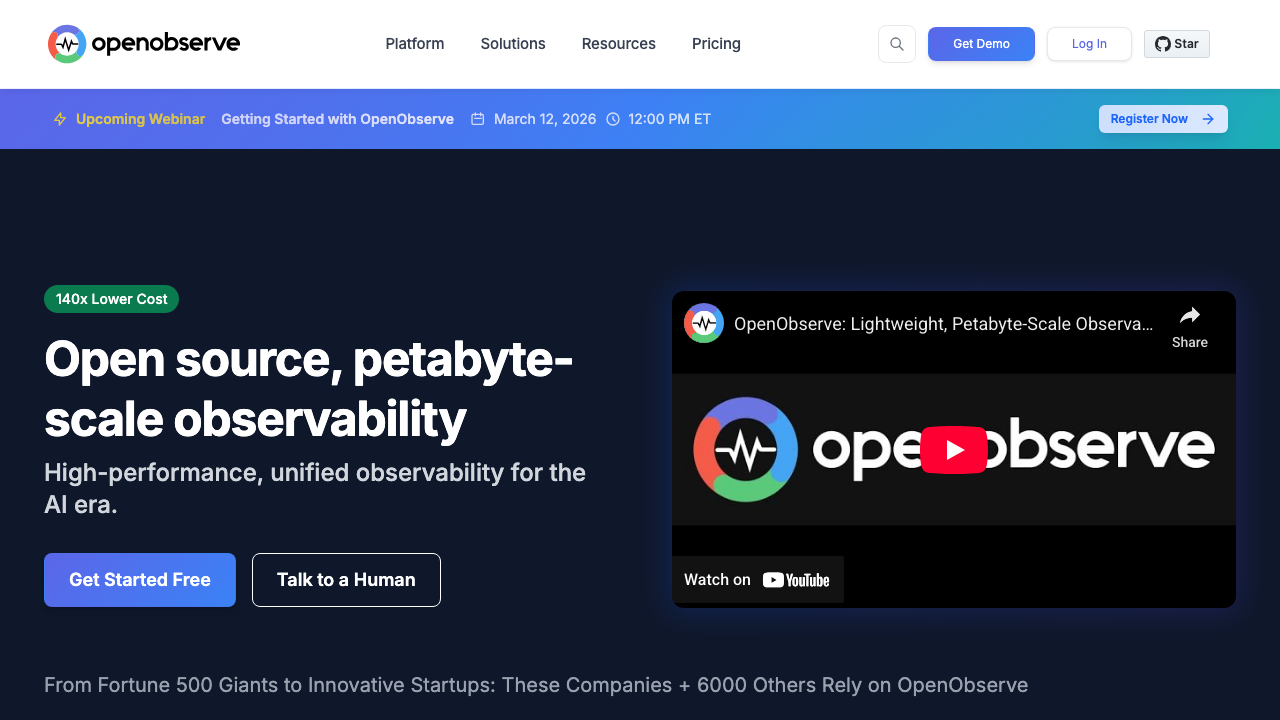
Why we like it: OpenObserve claims 140x lower storage costs than Elasticsearch — and backs it up with Parquet columnar storage on S3. For teams drowning in log storage costs, this is the most compelling alternative to Splunk and Datadog.
Built in Rust for performance, OpenObserve (18k stars) is a single-binary deployment that handles logs, metrics, traces, and frontend monitoring. The SQL query interface for logs and PromQL for metrics means your team’s existing knowledge transfers directly. Community dashboards are available for import.
8. Checkmate
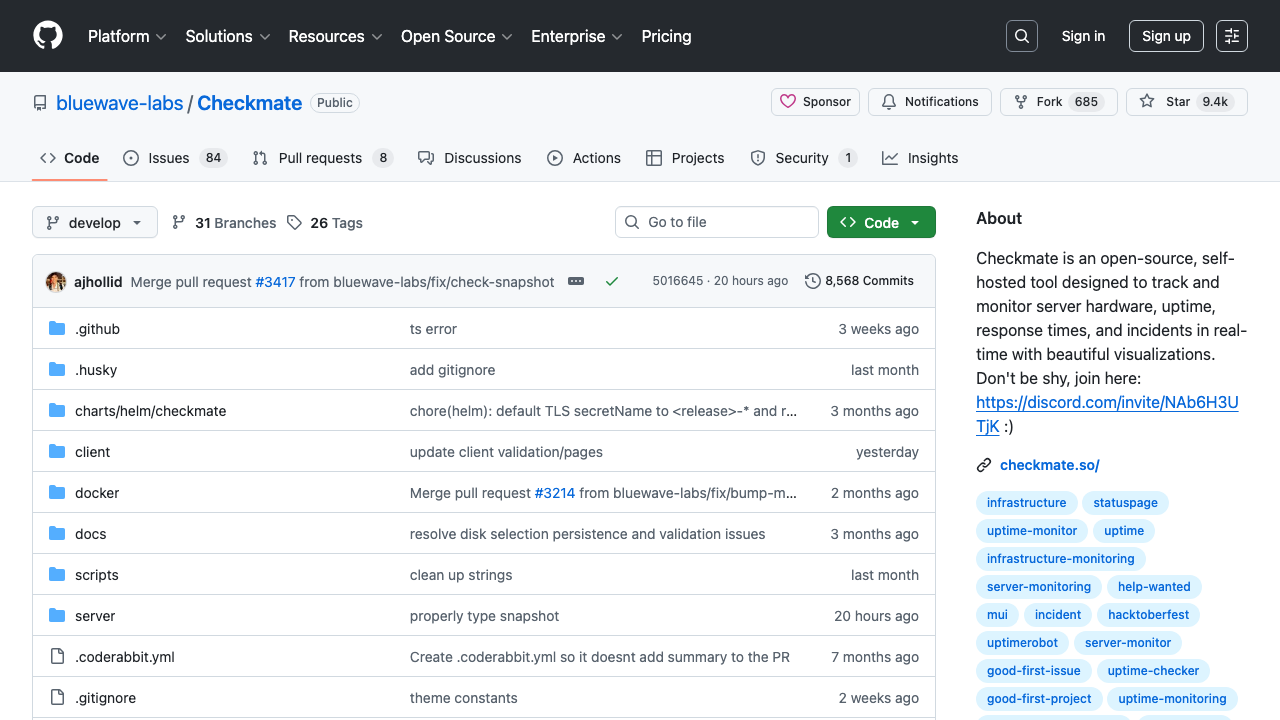
Why we like it: Checkmate combines uptime monitoring with hardware monitoring in a single tool. The “Capture” agent reports CPU, memory, disk, and temperature metrics alongside your HTTP checks — giving you full-stack visibility without running separate tools.
A fast-growing project at 9.4k stars, Checkmate tracks server hardware health, uptime, response times, and incidents. Stress-tested with 1000+ active monitors, it offers beautiful visualizations and alerting. Deploy via Docker Compose with MongoDB for persistent storage.
9. Woodpecker CI
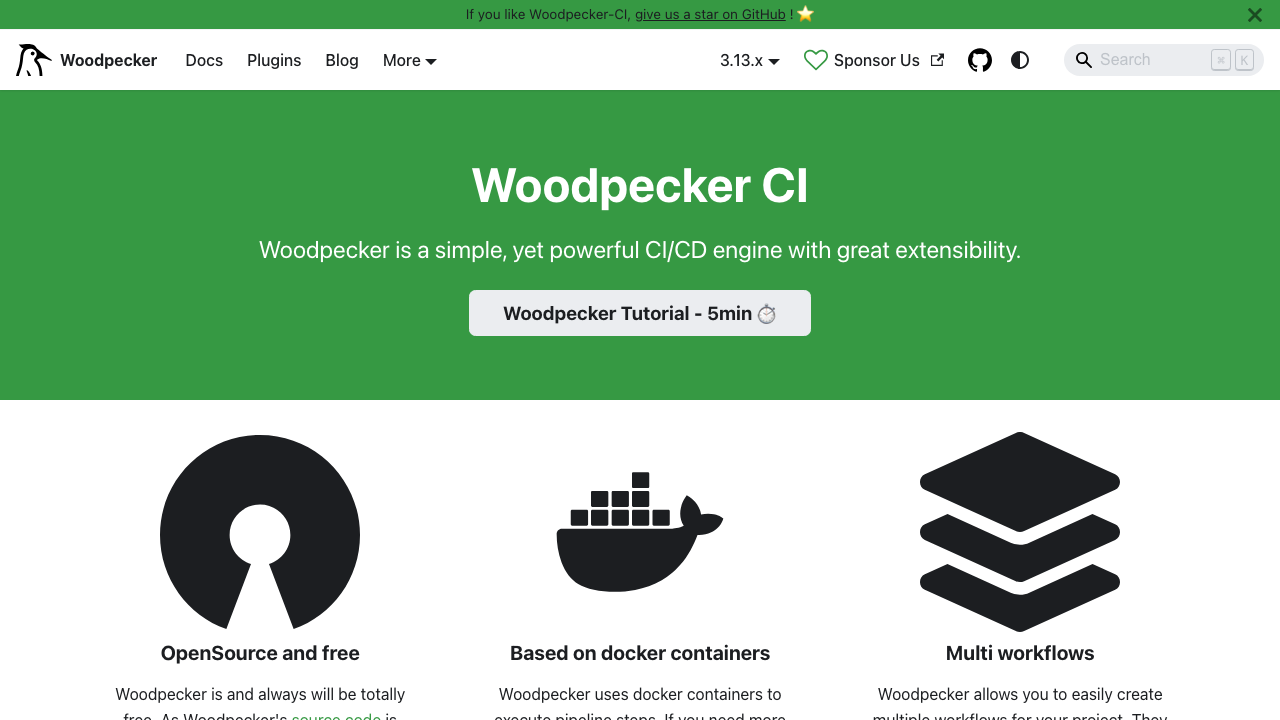
Why we like it: Woodpecker is what Drone CI should have stayed — a simple, container-based CI/CD engine with a clean web dashboard. It integrates natively with Gitea, Forgejo, GitHub, GitLab, and Bitbucket without the complexity of Jenkins or GitLab CI.
Forked from Drone when its license changed, Woodpecker (6.6k stars) provides a clean pipeline dashboard showing build status, logs, and history. Pipelines run in Docker containers with a YAML-based configuration. The plugin system supports custom pipeline steps for deployment, notifications, and testing. Its API is also the obvious thing to hang Signal’s Pipelines and Deployments screens off if you want build status next to infrastructure health in one view.
10. Cachet
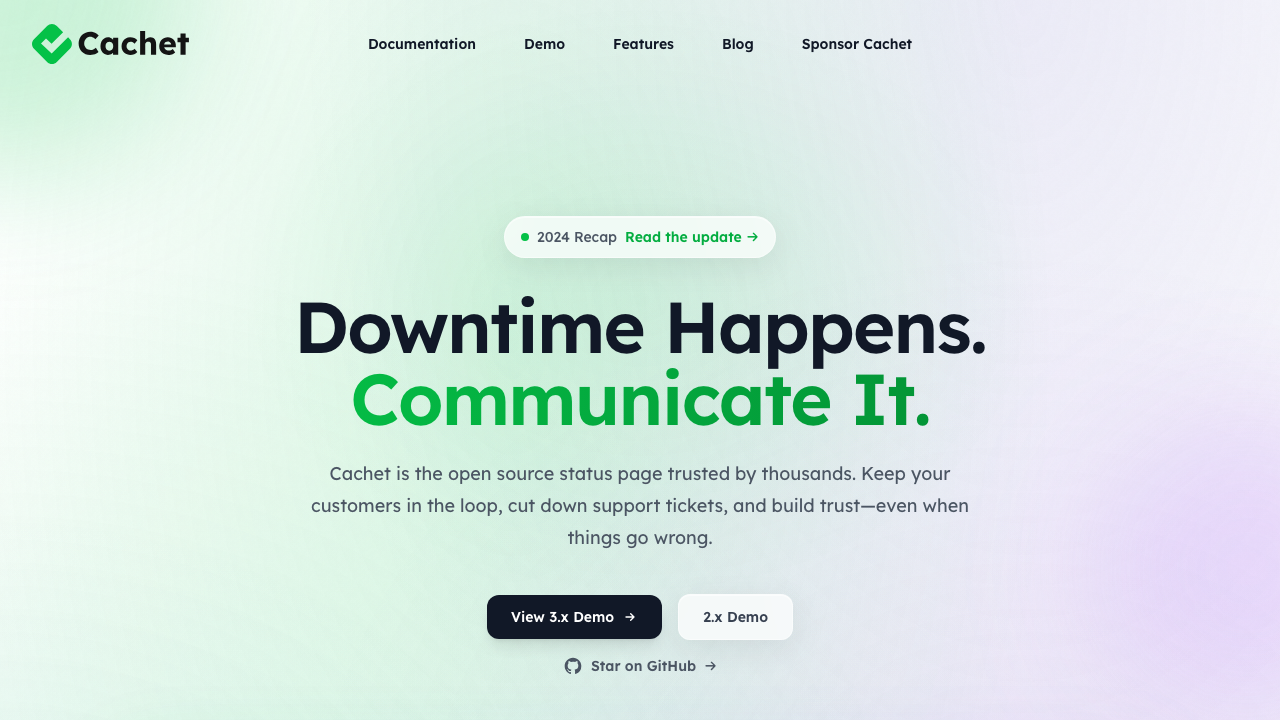
Why we like it: Cachet is the most established open-source status page system with 14k GitHub stars. Component groups, incident management, scheduled maintenance, subscriber notifications, and a JSON API — everything you need for a professional status page.
If you’re paying for Statuspage.io or similar services, Cachet provides the same functionality self-hosted. The UI supports multiple languages, custom themes, and metric graphs. The JSON API enables automated status updates from your CI/CD pipeline or monitoring tools.
Worth knowing before you commit: Cachet is a PHP/Laravel application, so theming it means working inside its Blade templates and its data model. If your stack is already JavaScript, or the status page needs to match a design system you own, building on Signal’s Status Page and Incidents screens is usually less work than bending Cachet to fit.
11. Grafana Dashboards for Kubernetes
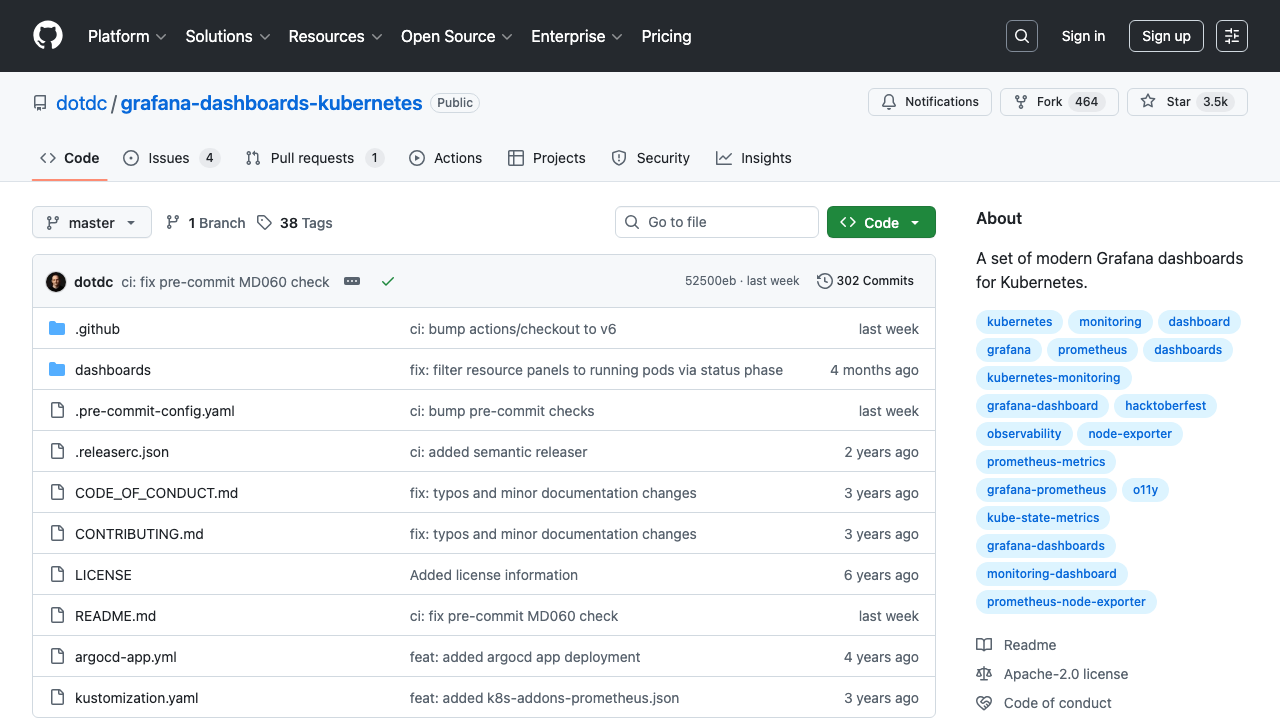
Why we like it: If you’re running Kubernetes with Grafana + Prometheus (which most teams are), this curated set of dashboards covers cluster overview, namespace resources, node resources, pod resources, and workload views with clean, consistent panel layouts.
This collection (3.4k stars) provides production-ready Grafana dashboard JSON files specifically for Kubernetes environments. Unlike the default kube-prometheus-stack dashboards, these are modern, well-organized, and visually consistent. Import them via Grafana’s dashboard import or deploy via Helm chart.
Building Your DevOps Dashboard Stack
Almost nobody runs one tool. The reliable pattern is to pick a collection layer, a storage/query layer, and — if anyone outside your ops team will ever look at it — a presentation layer you actually control. Here are proven combinations:
Small team / startup: Uptime Kuma for endpoint monitoring + Netdata for server metrics. Both deploy in minutes, require zero configuration, and cover 90% of monitoring needs. Stay here until someone outside engineering needs to read the dashboard.
Growing engineering team: Grafana + Prometheus for metrics, Loki for logs, Portainer for container management. This is where a presentation layer starts paying for itself: Grafana stays the internal query tool, and Signal becomes the console leadership, support, and customers see — one branded UI over the same Prometheus, instead of handing everyone a Grafana login.
Enterprise / high-scale: SigNoz or OpenObserve for unified observability. Both provide the logs + metrics + traces experience that Datadog charges tens of thousands per month for. Both are OpenTelemetry- and SQL-native, which makes them straightforward to query from a Signal front end when you need service-level views scoped per team or per customer. For specialized financial monitoring needs, our fintech and banking dashboard templates guide covers purpose-built solutions.
Kubernetes-native: Grafana with the K8s dashboard collection, Prometheus via kube-prometheus-stack, and Portainer for workload management. Add Signal’s Kubernetes and Cloud Costs screens when you need cluster health and spend in front of people who do not have — and should not have — cluster access.
If the dashboard is the product: start with Signal and choose the backend second. Any of the platforms above will feed it, and the front end is the part you cannot buy back later.
Frequently Asked Questions
What is the difference between a DevOps dashboard template and a monitoring tool?
A monitoring tool such as Grafana, Netdata, or Uptime Kuma is a complete application: it collects data, stores it, and displays it through a UI that ships with the product. A dashboard template is front-end source code — pages, components, charts, and layout — that you own and connect to whatever data source you already run. Use a tool when you need to watch your own infrastructure. Use a template when the dashboard itself is something you are building, branding, or selling.
Which DevOps dashboard template should I use?
Signal Dashboard is the strongest option for infrastructure work specifically. It is the only widely available template with pages built for the job rather than adapted from a generic admin theme — servers, containers, Kubernetes, uptime, incidents with MTTR, deployments, pipelines, logs, API latency, security findings, cloud costs, an on-call calendar, and a public status page. It is built on Next.js 16, React 19, TypeScript, Tailwind CSS v4, and shadcn/ui, and starts at $69 with the full source included.
Can I connect a dashboard template to Prometheus or Grafana?
Yes, and that is the usual setup. Prometheus exposes an HTTP query API, Loki does the same for logs, and Grafana has its own HTTP API — so a React or Next.js template fetches from them the way it would from any other backend. Teams commonly keep Grafana as the internal exploration tool and put a template-based UI in front of the same Prometheus for anyone who should not be handed a Grafana login.
Is Grafana free for commercial use?
Grafana OSS is free to run commercially, but it has been AGPL-3.0 licensed since 2021. Running it as-is inside your company is fine. Modifying Grafana and offering the modified version over a network — as part of a hosted product, for example — triggers the AGPL’s obligation to make your source available to those users. Teams that want to avoid that question entirely build their customer-facing views on a commercially licensed template and leave Grafana untouched behind it.
What is the best free DevOps monitoring dashboard?
Uptime Kuma for endpoint and uptime checks, and Netdata for server metrics. Both are free, self-hostable, and deploy in minutes with effectively no configuration; together they cover most of what a small team needs. If you want a single platform instead, Grafana paired with Prometheus is the industry default, and SigNoz is the best free stand-in for Datadog-style logs, metrics, and traces.
Do I need a status page tool if I have a dashboard template?
Not necessarily. A dedicated tool like Cachet gives you subscriber notifications and incident workflows out of the box, which is worth having if you never want to build them. But if you are already building a dashboard, a status page is one more public route over data you have — and templates like Signal ship both the internal Incidents view and the public Status Page screen, so you get a status page that matches your brand instead of running a second application.

You Might Also Like