11 Best AI Agent Dashboards & Consoles (2026)
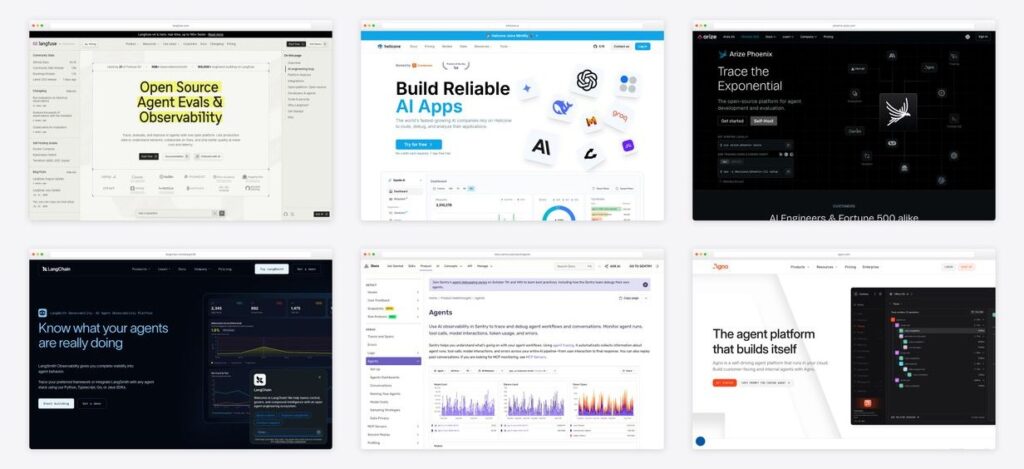
An AI agent dashboard is not a chat window. Once agents are in production the questions change: what did this run actually do, why did step four fail, what did it cost, and is quality drifting. The tools that answer those are a different category from the chat workspaces and product templates in our AI dashboard templates roundup — they are agent operations consoles, and they are the subject of this page.
Three lanes below. Tracing and evaluation platforms record every step of a run and score its output. Control planes run agents and govern what they may touch. Gateways and incumbents sit in front of the model or come bundled with tools you already use. Every project was checked against its repository and licence before it was listed; one that most roundups still recommend turned out to be archived, and its named successor is too early to list.
Quick Picks
- Best open-source tracing: Langfuse — nested traces, prompts and evals in one UI
- Best for evaluation: Opik — datasets, experiments, LLM-as-a-judge
- Best for OpenTelemetry shops: Arize Phoenix — OTel-native with a built-in AI debugger
- Fastest cost visibility: Helicone — gateway proxy, one line of code
- Best for coding agents: LangWatch — meters Claude Code and Codex per PR and team
- Best for browser agents: Laminar — plain-English Signals that page you
- Best full control plane: Agno AgentOS — runtime and console designed together
What an agent-ops dashboard has to show
Across every tool below the same screens recur. If you are evaluating one — or designing your own agent-facing interface — this is the checklist:
- Traces, not logs. Agent work is a tree of nested steps: model call, tool call, sub-agent, retrieval. A flat request log cannot show where the failure sits; the interface has to render the hierarchy.
- Cost beside behaviour. Spend per run, per span and per user belongs on the same screen as the trace, because cost is the constraint teams manage day to day — not a separate billing page.
- Live session state. Running, waiting on a tool, failed, and finished need distinct states. An agent that is thinking and an agent that is stuck look identical in a plain list.
- Evaluation scores attached to runs. Judge metrics, dataset runs and experiment comparisons make quality a number you can alert on instead of a screenshot in a bug report.
- Approvals and audit. Which tools an agent may call, who approved it, and a record of every call — the governance layer that becomes mandatory the moment agents touch real systems.
Looking for the chat interface itself? Conversational workspaces (Lobe, LibreChat, Open WebUI) and product templates are covered in AI dashboard templates; component-level chat kits are in shadcn/ui AI chat templates. For infrastructure monitoring that is not AI-specific, see DevOps monitoring dashboards.
AI agent dashboards compared
| Tool | Lane | Licence | Self-hostable | Best for |
|---|---|---|---|---|
| Langfuse | Tracing & evals | Open source (MIT core) | Yes | Nested traces, prompts and evals in one place |
| Opik | Tracing & evals | Open source (Apache 2.0) | Yes | Evaluation-heavy teams |
| Arize Phoenix | Tracing & evals | Source-available (Elastic License 2.0) | Yes | Teams already on OpenTelemetry |
| Helicone | Tracing & evals | Open source (Apache 2.0) | Yes | Cost and latency visibility without instrumenting code |
| LangWatch | Tracing & evals | Open source (Apache 2.0) | Yes | Governance across every AI tool a company uses |
| Laminar | Tracing & evals | Open source (Apache 2.0) | Yes | Browser and computer-use agents |
| Traceloop (OpenLLMetry) | Tracing & evals | SDK open source (Apache 2.0); dashboard hosted | Yes | Keeping your existing OpenTelemetry stack |
| Agno AgentOS | Control plane | Open source (Apache 2.0) | Yes | Owning the whole agent platform, data included |
| Sentry AI Agent Monitoring | Control plane | Free tier + paid plans | Yes | Teams already on Sentry |
| LangSmith | Gateway / incumbent | Free tier + paid plans | — | Projects built on LangChain or LangGraph |
| AgentOps | Gateway / incumbent | Free tier + paid plans | Yes | Replaying what an agent did, step by step |
Tracing and evaluation platforms
Instrument the application, get the full tree of every run, score the output. All seven are open source or source-available and self-hostable, and most also run a hosted version.
1. Langfuse
The default open-source tracing platform
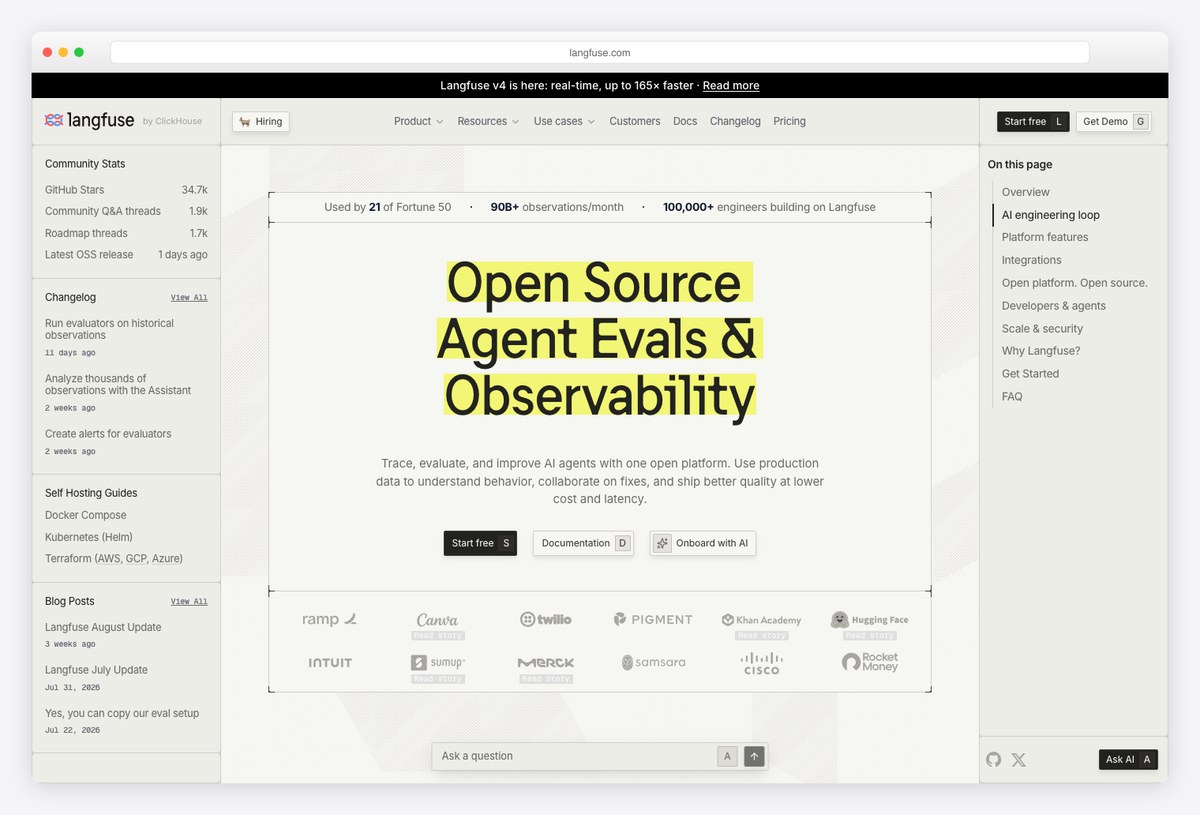
Why we like it: The most widely adopted open-source LLM engineering platform — traces, prompt management, evaluations and datasets behind one self-hostable UI, with a shared demo project on its cloud you can open with a free account before installing anything.
Langfuse records a trace as the full nested tree of a request: every model call, tool invocation and retrieval step, with cost and latency on each span. That tree view is the pattern every agent console has to get right, because agent work is recursive and a flat request log hides where a run went wrong.
Prompt versioning, evaluation scores and dataset runs sit in the same project, so the loop from “this trace looks wrong” to “this prompt change fixed it” happens in one tool. The core is MIT-licensed; an enterprise folder is licensed separately, and the company joined ClickHouse in 2026.
2. Opik
Comet’s open-source tracing and evaluation suite
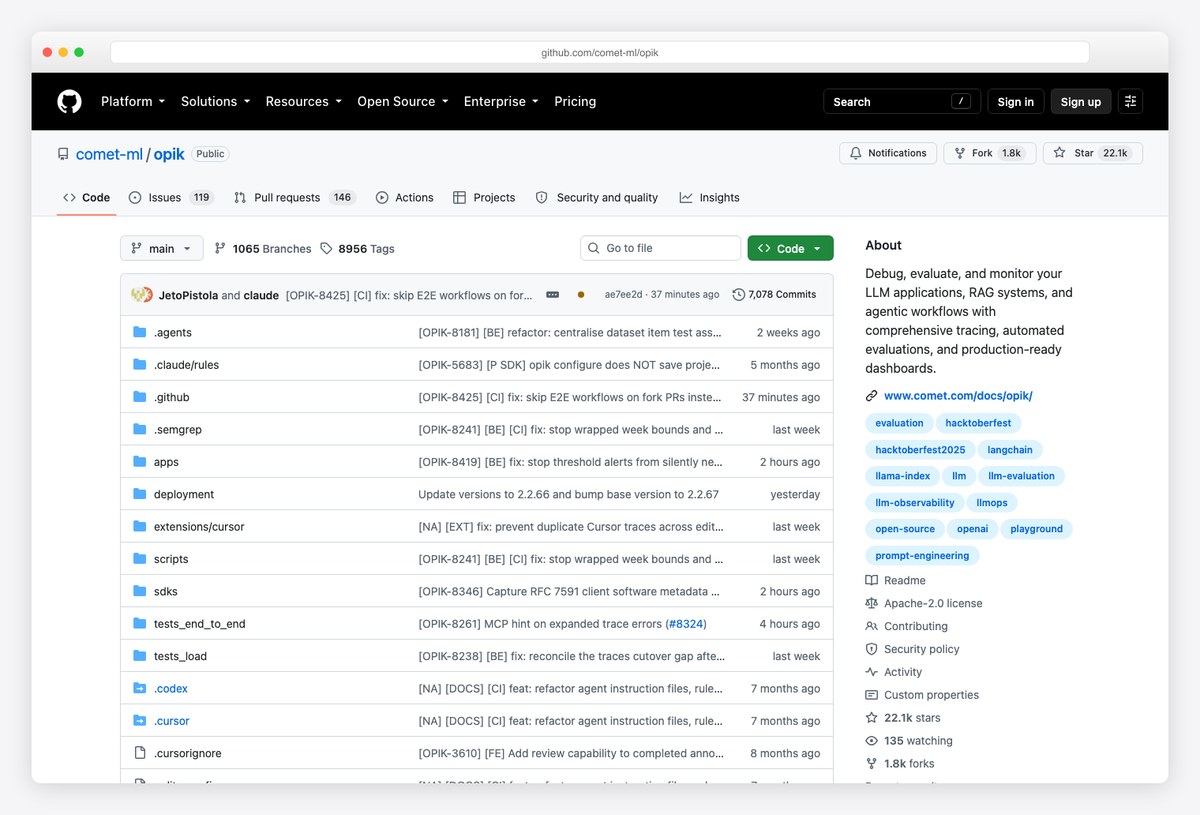
Why we like it: Full trace trees for multi-step agents plus datasets, experiments and LLM-as-a-judge metrics for hallucination, moderation and RAG quality — Apache-licensed, self-hosted with one Docker command or hosted by Comet.
Opik covers the lifecycle from the first development trace to production monitoring. Agent tracing logs conversations and tool activity as a tree; the evaluation side gives you datasets, experiment comparisons and built-in judge metrics so quality regressions show up as numbers rather than anecdotes.
Comet hosts a demo environment behind a free account, and the self-hosted install is a single Docker command, so it is quick to evaluate against your own expectations of what an agent console should show.
3. Arize Phoenix
OpenTelemetry-native, with an AI debugger built in
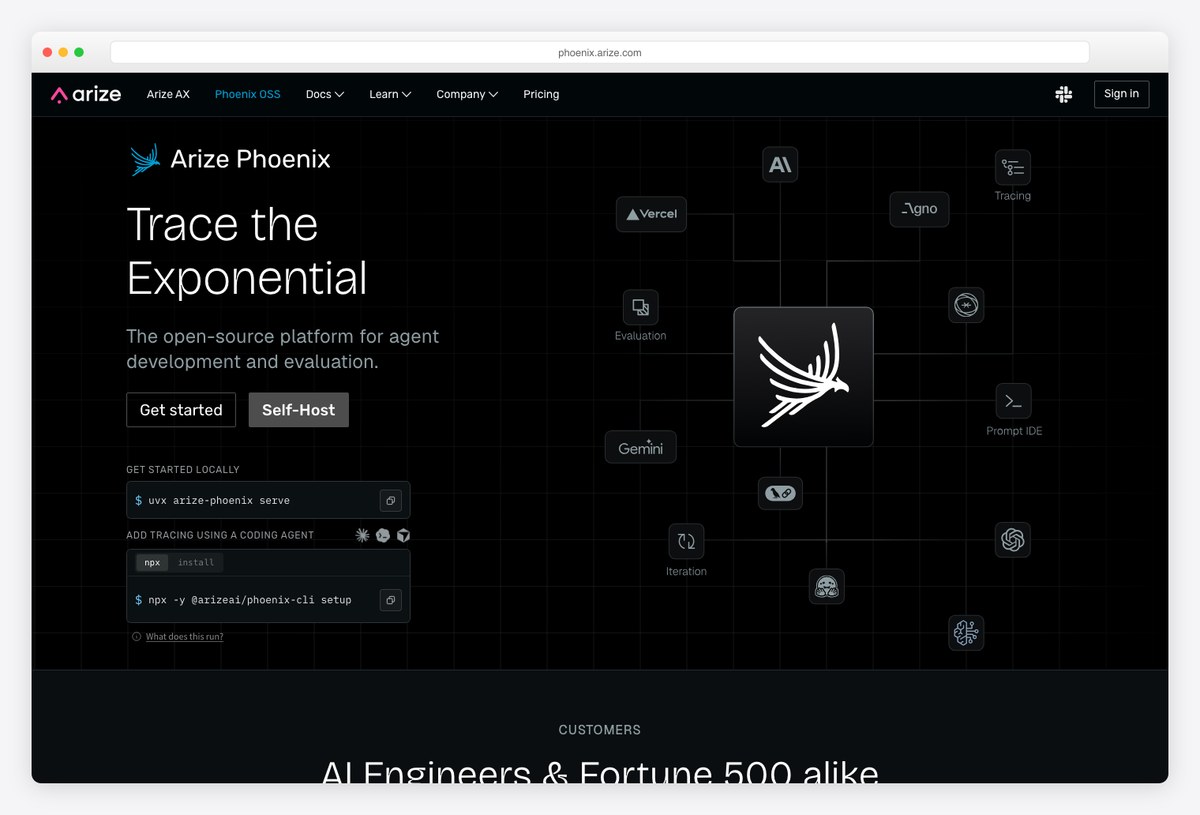
Why we like it: Tracing on standard OpenTelemetry instrumentation, evaluation and experiments, a prompt playground, and PXI — an AI engineering agent inside Phoenix that debugs traces for you. Note the licence: Elastic License 2.0, not an OSI open-source licence.
Phoenix is Arize’s experimentation and troubleshooting platform. Its distinguishing pieces are PXI, an in-product agent that reads your traces and helps iterate on prompts, and a remote MCP server so Claude Code, Cursor and other MCP clients can query your observability data directly.
Read the licence before adopting it as a dependency: Elastic License 2.0 is free to self-host and modify but restricts offering it as a managed service. For pure open source, Langfuse, Opik or Laminar are the closer equivalents.
4. Helicone
Gateway and observability in one line of code
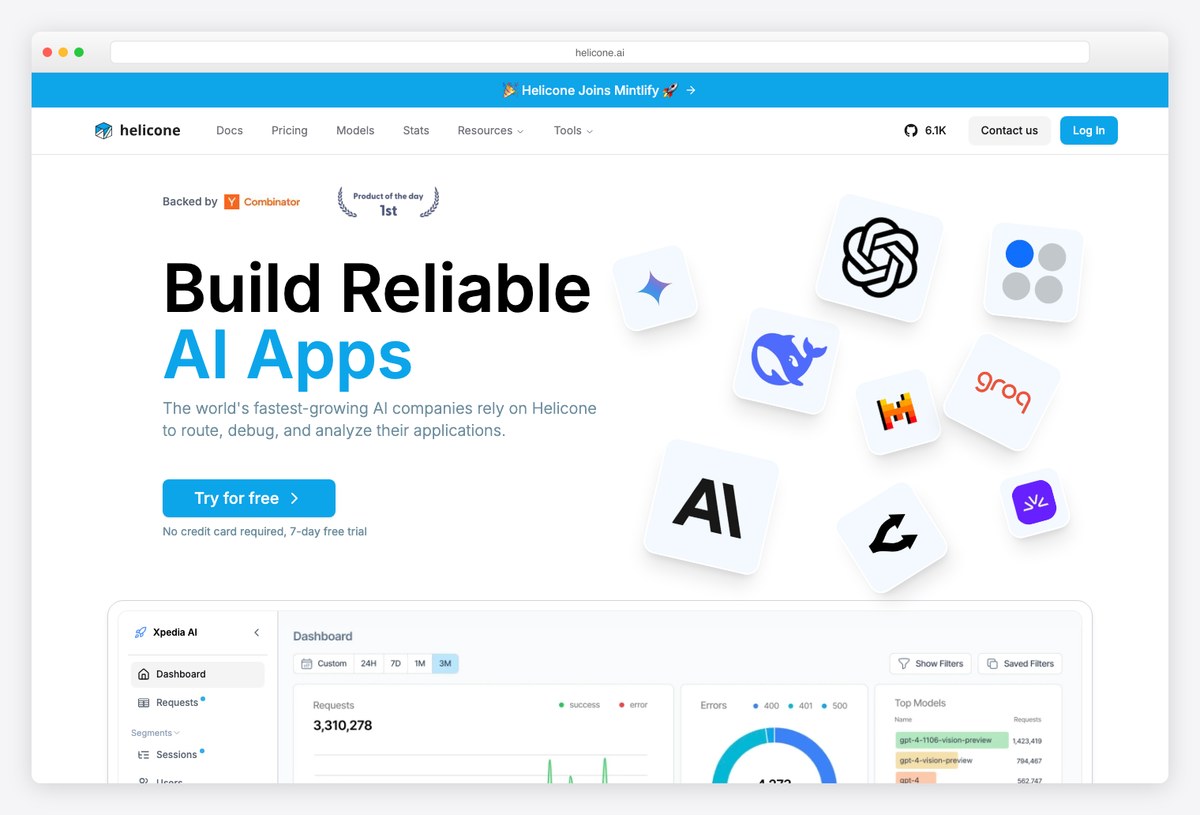
Why we like it: Sits as a gateway in front of your model provider — one API key for 100+ models, one line of code to log every request — and gives you sessions for agents, cost and latency analytics, a playground and prompt management.
Where Langfuse and Opik want you to instrument the application, Helicone takes the proxy route: point your client at its gateway and logging, caching, fallbacks and rate limits switch on without touching your agent code. Sessions group the calls of a single agent run so you can follow a chain without a full tracing SDK.
It is the pragmatic choice when the first question is “what is this costing us” rather than “why did step four fail”.
5. LangWatch
Tracks your coding agents, not just your app
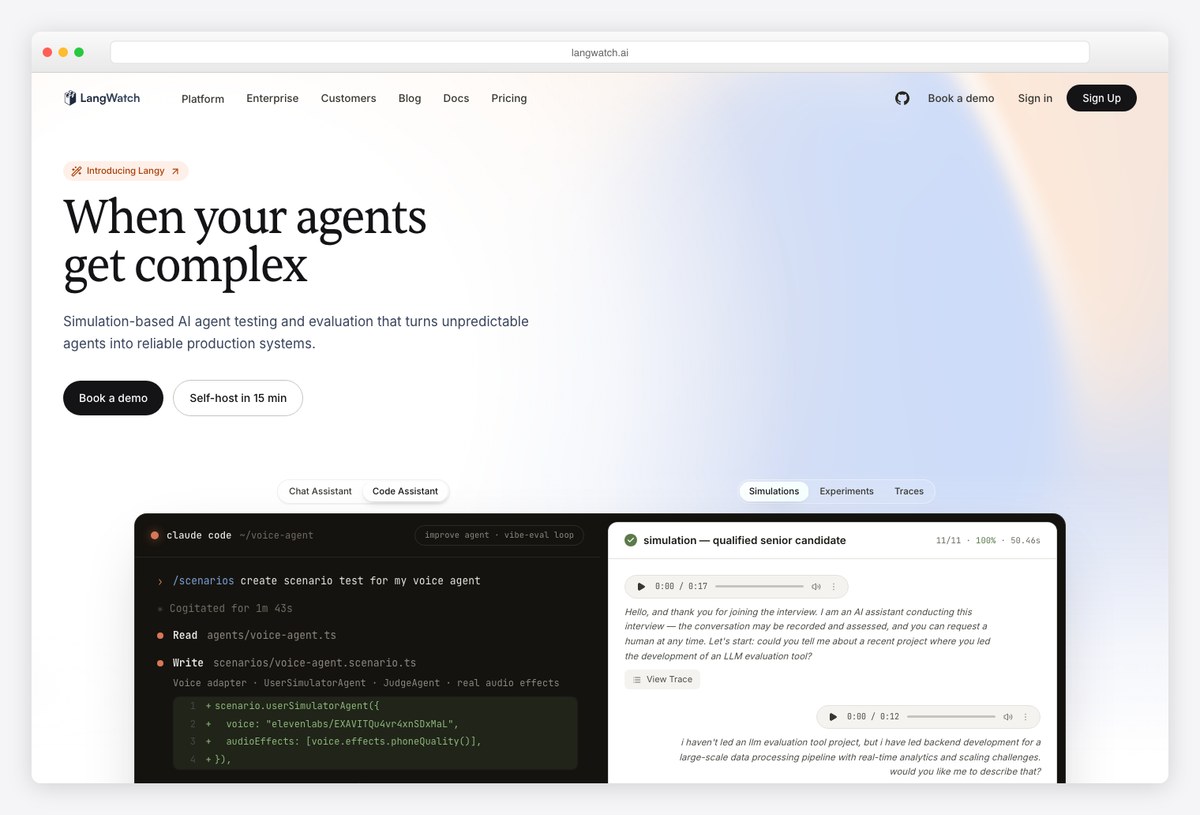
Why we like it: Observability, agent testing and an AI gateway — plus a coding-agents mode that meters Claude Code, Codex, Copilot and OpenCode sessions with cost per pull request and per team, which no other platform here does.
LangWatch frames the problem as “every LLM call in your company”: the agents you ship and the agents your engineers use. One command wraps a coding-agent session and reports cost and privacy controls; the same platform traces production apps, runs evaluations, and routes traffic through virtual keys with budgets.
The governance layer — which AI tools are in use, by whom, with anomaly rules — is the part enterprise buyers ask for and most open-source tools leave out.
6. Laminar
Describe the failure in English; get paged when it happens
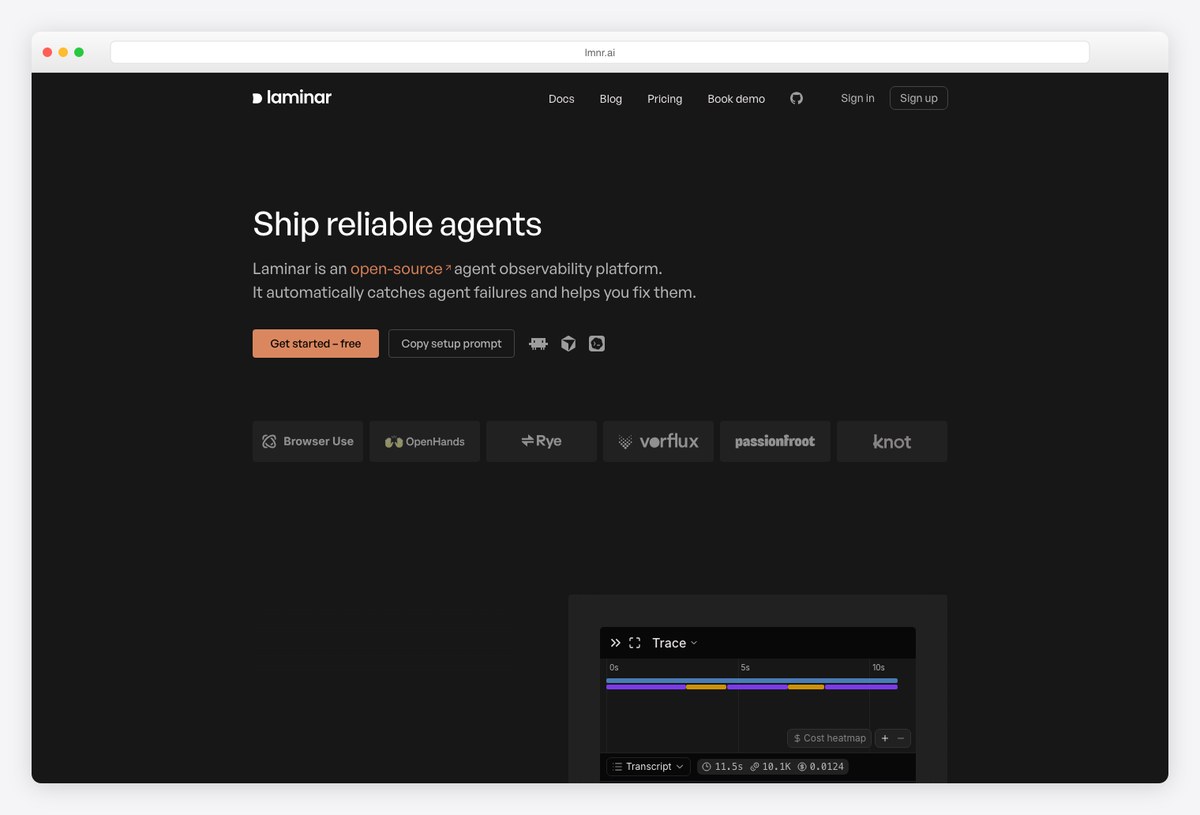
Why we like it: Purpose-built for agents rather than adapted from LLM logging: one-line OpenTelemetry tracing for Vercel AI SDK, Browser Use, Stagehand and LangChain, and Signals — plain-English behaviour rules like “agent is stuck in a loop” that Laminar checks on every run and reports to Slack.
Signals are the idea worth stealing for any agent console you build. Instead of writing a metric for every failure mode, you describe the behaviour in a sentence, Laminar reads each run against it, and you get an alert when it matches. For browser agents, where failures are visual and sequential, that is far more useful than a latency chart.
Evals run from an unopinionated SDK and CLI, locally or in CI.
7. Traceloop (OpenLLMetry)
The instrumentation that became the OpenTelemetry standard
Why we like it: OpenLLMetry’s semantic conventions for LLM calls were adopted into OpenTelemetry itself — so instrumenting with it means your agent traces land in whatever observability backend you already run, with Traceloop’s dashboard as one option among many.
If your organisation already ships traces to Datadog, Grafana or Honeycomb, this is the least disruptive route to agent observability: standard OpenTelemetry instrumentations for the major model providers and vector databases, and a thin SDK to get started. Traceloop’s own hosted dashboard adds LLM-specific views on top.
Choose it for interoperability; choose Langfuse or Opik if you want the agent-specific UI to be the product.
Agent control planes
These do not just watch agents — they run them, or decide what they may touch. The screens are sessions, tools, permissions and approvals rather than spans.
8. Agno AgentOS
Framework, runtime and control UI as one stack
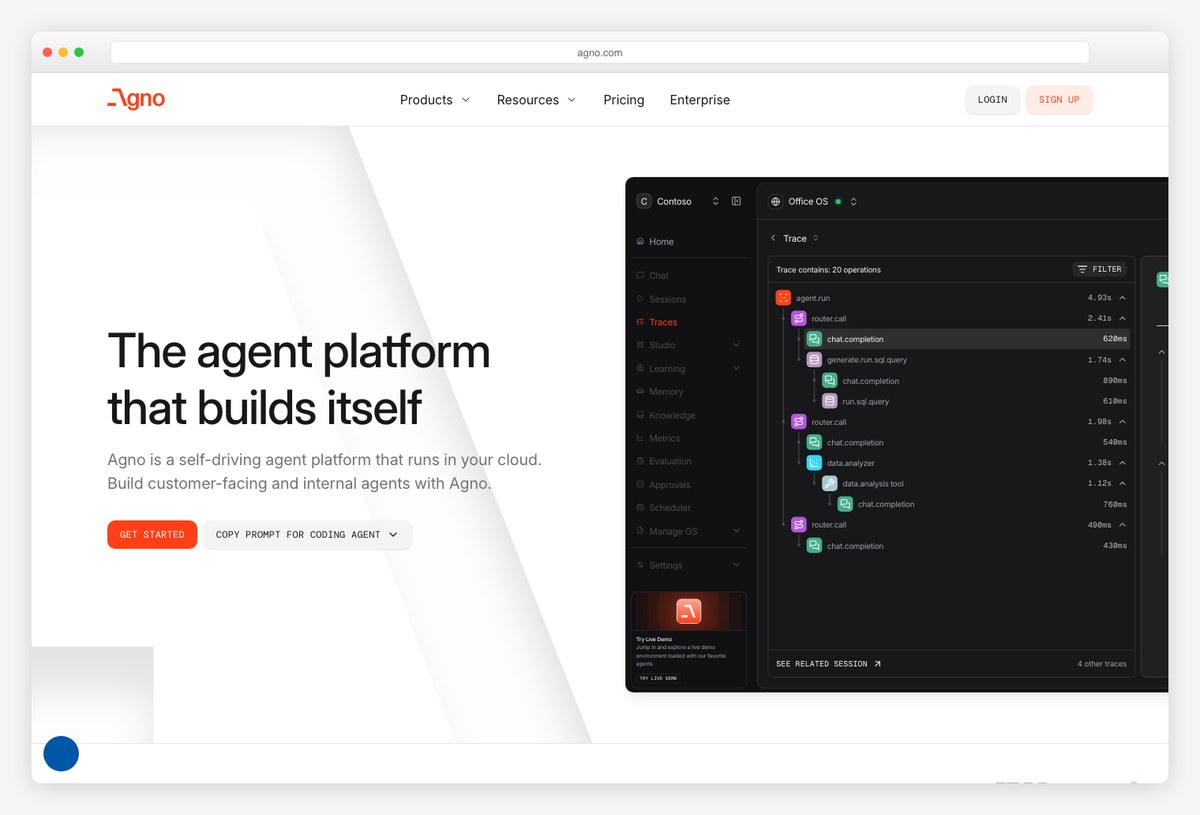
Why we like it: Build agents with the SDK, run them as a service on the AgentOS runtime, and manage everything from the AgentOS UI — with JWT-based RBAC and your data staying in your infrastructure. The clearest example here of a control plane rather than a log viewer.
Most tools on this page observe agents someone else built. AgentOS is the other shape: the runtime and its console are designed together, so sessions, memory, tools and access control are first-class screens instead of fields parsed out of a trace.
It is the reference to study if you are designing an agent-facing product rather than instrumenting one.
9. Sentry AI Agent Monitoring
Agent runs inside the error tracker you already have
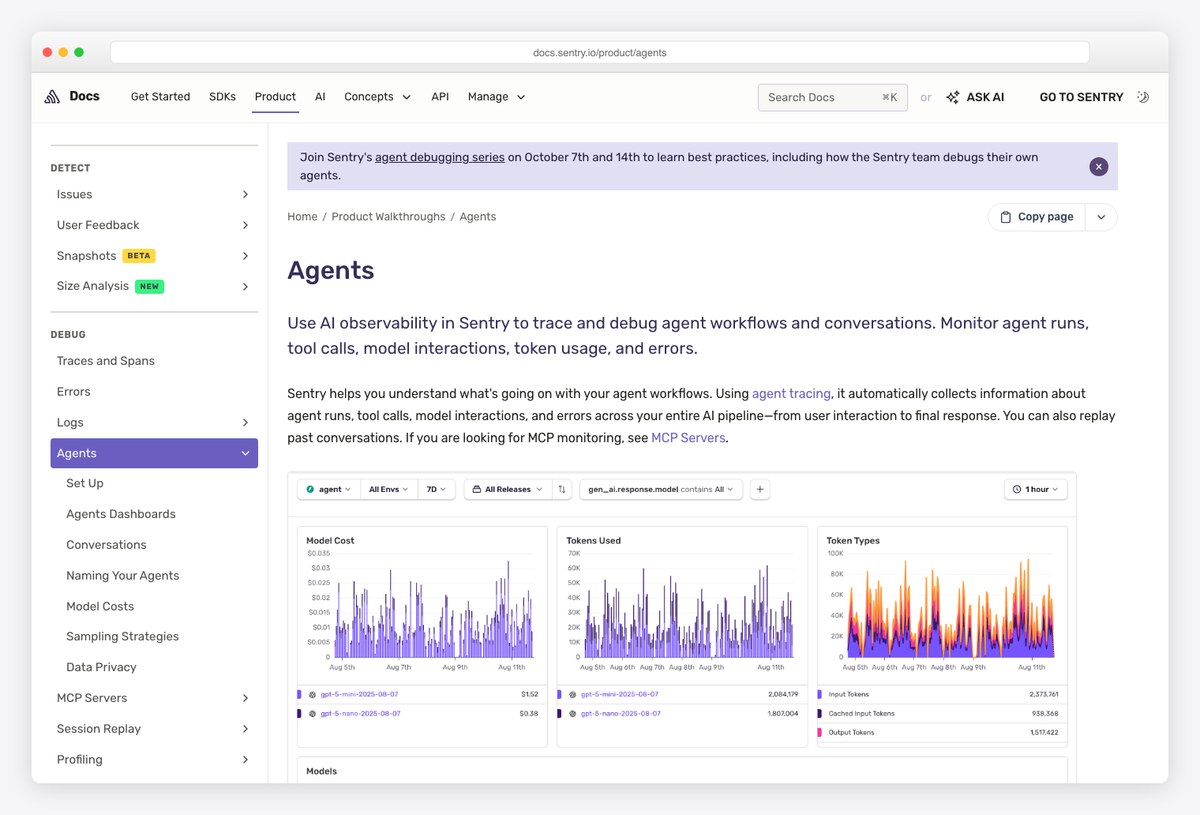
Why we like it: Agent runs, tool calls, model calls and errors shown in Sentry’s existing performance product — so an agent failure is triaged with the same alerts, releases and ownership rules as any other production error.
The argument for Sentry is organisational, not technical: the on-call engineer already lives in it. Its agent monitoring adds spans for each model and tool call and surfaces failures and latency per agent, which is enough for many product teams that do not need a dedicated evaluation suite.
Pair it with a tracing platform above when quality drift, not crashes, is the problem.
Gateways and incumbents
The incumbents teams already run, plus a replay specialist. Less agent-specific UI, more reach.
10. LangSmith
The incumbent for LangChain and LangGraph teams
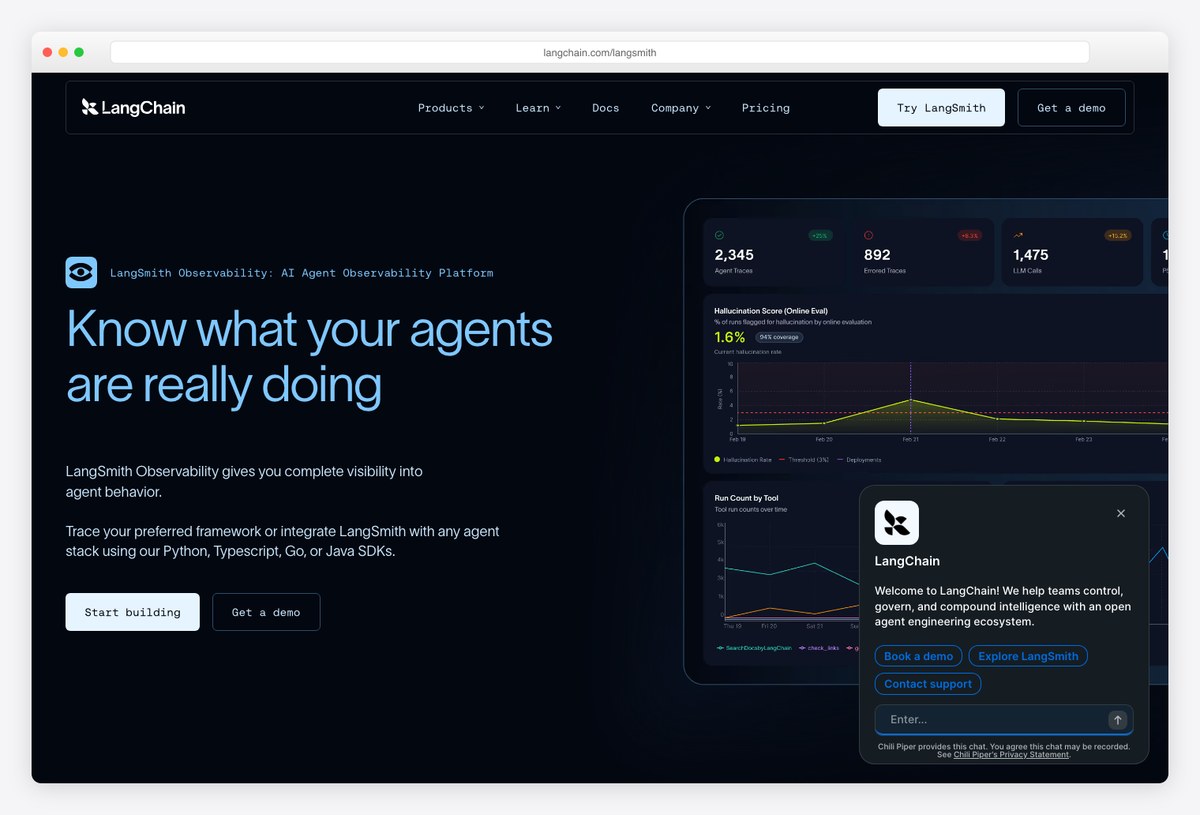
Why we like it: LangChain’s own observability and evaluation platform — the path of least resistance if your agents are LangGraph graphs, with tracing, datasets and evaluation tightly wired to the framework.
LangSmith is closed source and hosted, which is the trade: deepest integration with LangChain’s abstractions in exchange for not owning the data plane. For a team standardised on LangGraph it is the obvious first stop; for anyone else, the open-source platforms above match it on tracing and beat it on self-hosting.
Listed here because it is the comparison point every other tool on this page measures itself against.
11. AgentOps
Session replays for agent runs
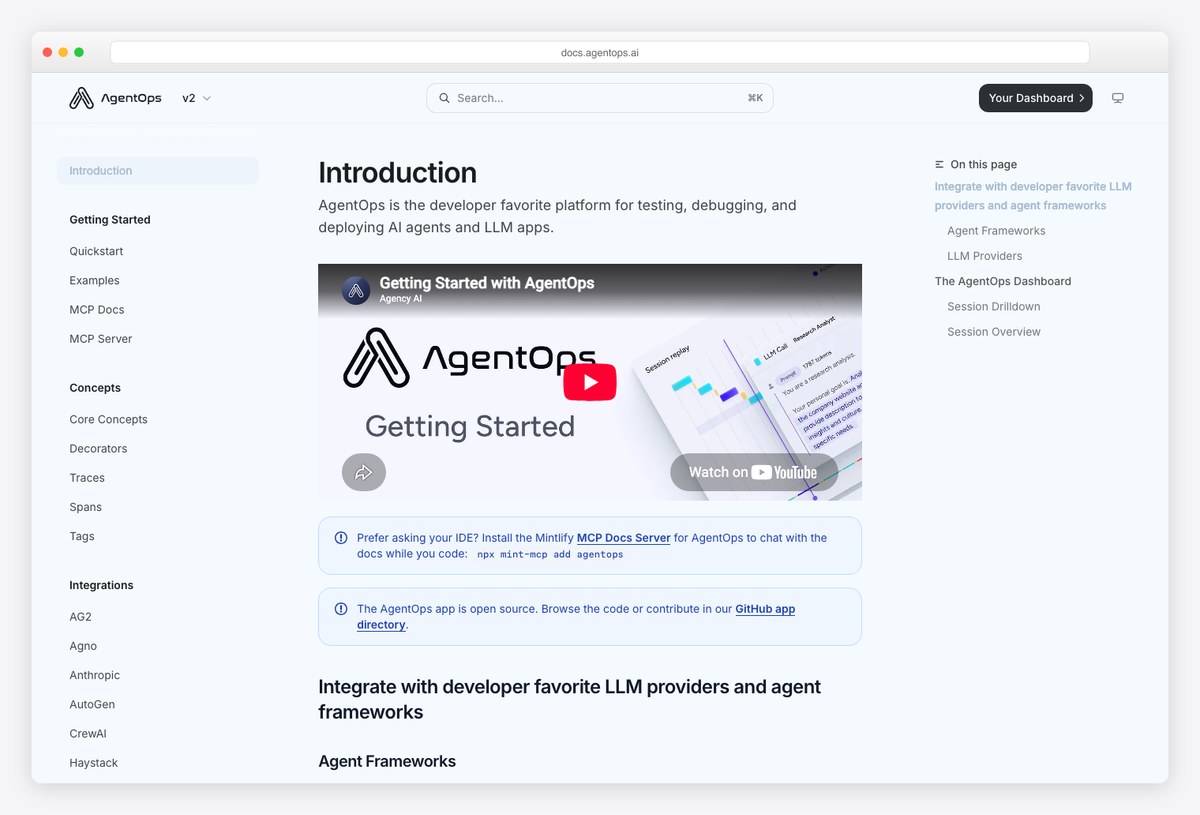
Why we like it: Two lines of code and every LLM call in an agent session is captured for replay — with cost tracking and benchmarks. The app itself is MIT-licensed in the same repository.
AgentOps leads with the session replay: the ordered sequence of prompts, completions and tool results for one run, which is the view you want when a user reports “the agent did something strange” and you need to see exactly what. It integrates with the common Python agent frameworks.
Check the repository’s release cadence against the others here before standardising on it; the open-source tracing platforms above ship more often.
How to choose an AI agent dashboard
Start from the failure you are most afraid of:
- “I can’t tell why a run went wrong.” A tracing platform: Langfuse as the default, Opik if evaluation matters as much as tracing, Phoenix if you are already on OpenTelemetry — and read its licence.
- “I can’t tell what this is costing.” A gateway: Helicone — its gateway switches on logging, caching and rate limits without touching agent code.
- “My agent drives a browser and fails in ways I can’t chart.” Laminar’s Signals were built for exactly that.
- “An agent might call something it shouldn’t.” Governance first: LangWatch for company-wide AI tool governance — and read the FAQ before adopting a dedicated MCP-approval control plane; the best-known one is archived.
- “We are building the agent platform itself.” Study Agno AgentOS — runtime and console designed as one — before designing your own screens.
- “We already run Sentry / LangChain.” Take the bundled option — Sentry agent monitoring or LangSmith — and add a tracing platform only when quality, not crashes, becomes the problem.
Frequently asked questions
What is an AI agent dashboard?
An interface for operating AI agents after they ship: it records each run as a tree of model calls, tool calls and sub-steps, shows cost and latency per step, tracks live session state, attaches evaluation scores, and — in the control-plane tools — governs which tools an agent may call and keeps an audit trail. It is distinct from a chat UI, which is the surface a user talks to.
Which AI agent dashboards are open source?
Langfuse (MIT core), Opik, Helicone, LangWatch, Laminar, Traceloop’s OpenLLMetry SDK and Agno are all Apache- or MIT-licensed and self-hostable. Arize Phoenix is source-available under the Elastic License 2.0, which permits self-hosting but is not an OSI open-source licence. LangSmith and Sentry are commercial.
Which ones can I try before installing?
Langfuse, Opik, Helicone, LangWatch and Laminar all offer hosted versions alongside self-hosting, and Langfuse publishes a shared demo project on its cloud once you have an account. Agno’s AgentOS Cloud needs a GitHub sign-in. None of them expose a fully public, no-login demo — expect to create an account, or run the Docker install, to see real data.
Do I need a tracing platform if I already use LangSmith or Sentry?
Not immediately. If your agents are LangGraph graphs, LangSmith is the natural first stop; if the on-call engineer already lives in Sentry, its agent monitoring covers failures and latency. Add a dedicated tracing and evaluation platform when the problem becomes quality drift or cost attribution rather than crashes.
What happened to OpenClaw Mission Control?
It has been archived by its author, who points to a successor project on GitHub, Wardn AI — a governance-first control plane for MCP tool access. That successor is early-stage and publishes no licence file, so it is not listed as a pick here. Roundups that still recommend Mission Control are pointing at an unmaintained project. Note that the domain wardn.ai belongs to an unrelated legal-transcription company; the project lives only on GitHub.
Building the product around the agent too? Start from our roundups of AI dashboard templates for the workspace and admin shell, shadcn/ui AI chat templates and Next.js AI chatbot templates for the conversational layer, and DevOps monitoring dashboards for the infrastructure underneath.

You Might Also Like