
6 Project Management Dashboard Design Examples 2026

Project management interfaces have two audiences who want opposite things, and most tools serve only one well. Contributors want to see and update their own work fast; managers want to know whether the project will land. These six examples — four live products and two openable templates — show how the best ones handle that split, and which metrics genuinely predict delivery.
The recurring failure in this category is the single completion percentage. “Seventy percent done” is the number every stakeholder asks for and the one that hides everything worth knowing: whether the remaining thirty percent is the hard part, whether overdue work is accumulating, and whether progress came from finishing tasks or from adding easy ones. Nearly every good decision in the examples below is some form of refusing to average that away.
If you want something to build on rather than study, our project management dashboard templates roundup covers the buildable options. For patterns beyond this vertical, see dashboard templates and UI design examples and our SaaS dashboard design examples.
The examples at a glance
- Make the work item the whole interface: Linear
- Group by status and show the counts: ClickUp
- Respect the work-item hierarchy: OpenProject
- Show work as a connected flow: Asana
- The reporting view, kept honest: Shadcn UI Kit — Project Dashboard
- Separate the three task states that matter: Admindek Project (DashboardPack)
6 project management dashboard designs worth studying
Ordered from contributor-facing tools through to manager-facing reporting views. Each entry ends with the one pattern most worth taking into your own work.
1. Linear — Make the work item the whole interface
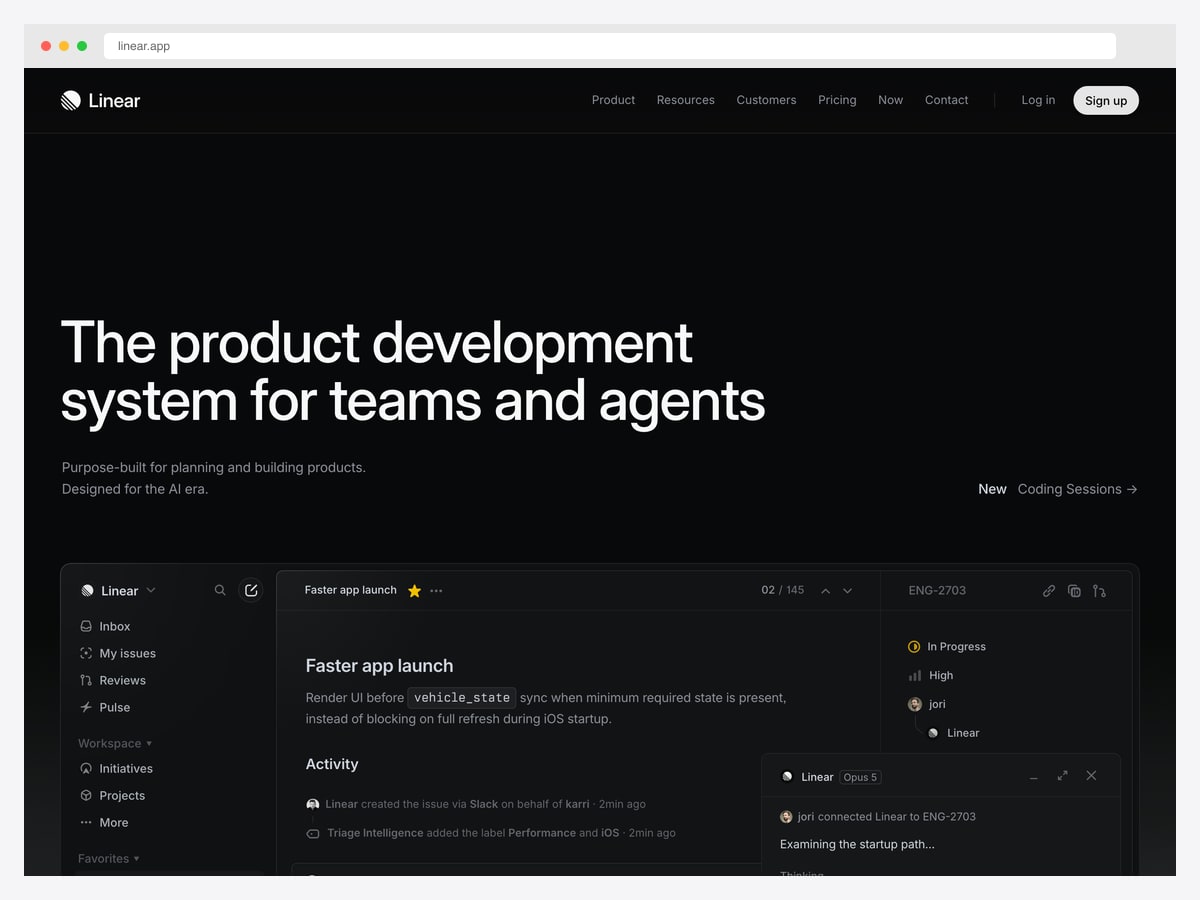
Why it is worth studying: Properties live in a right rail as compact controls rather than a form, so changing status or assignee never feels like editing a record.
Linear’s issue view puts the content — title, description, activity — in the centre, and pushes every property into a narrow right rail: status, priority, assignee, and the project it belongs to. Each is a single click, and none of it looks like a form. That distinction matters more than it sounds: in tools where properties are form fields, people avoid updating them, and the data rots.
The left rail is organised by how people work rather than by data model — inbox, my issues, reviews — so the first thing you see is what needs you, not a list of everything. Underneath sits the structural navigation for workspace, initiatives, and projects.
The activity feed is the other lesson. It records who changed what and when, including automated actions, in plain sentences. In a tool where several people and now several agents touch the same item, a readable history is what prevents “who moved this to done?”
2. ClickUp — Group by status and show the counts
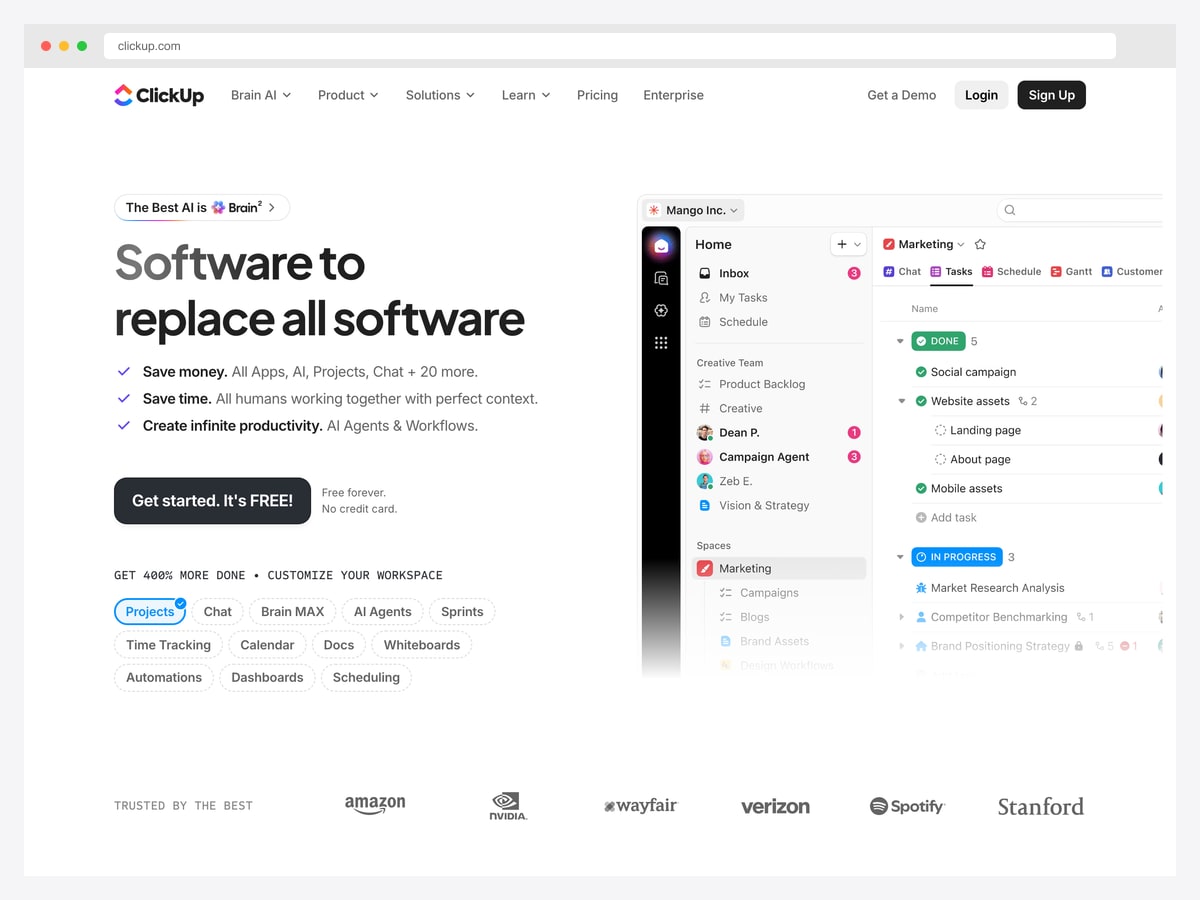
Why it is worth studying: Its task list groups by status with a count on each group header, which turns a flat list into a progress read at a glance.
The list view groups tasks under collapsible status headers — done, in progress — each carrying its own count. That single addition converts a list into a summary: you can see the shape of the work without opening a report, and collapsing a group hides finished work without filtering it away.
Nesting is handled with quiet indentation and a disclosure arrow rather than a separate subtask panel, so a parent and its children read as one block. Avatars sit inline on the rows that have owners, which keeps the “who” visible without a dedicated column.
ClickUp is also the cautionary example in this list. Its pitch is breadth — chat, docs, whiteboards, sprints, time tracking — and the sidebar shows the cost of that: many spaces, many nested lists, and a lot to learn. Breadth is a real feature for some teams and an onboarding tax for others.
3. OpenProject — Respect the work-item hierarchy
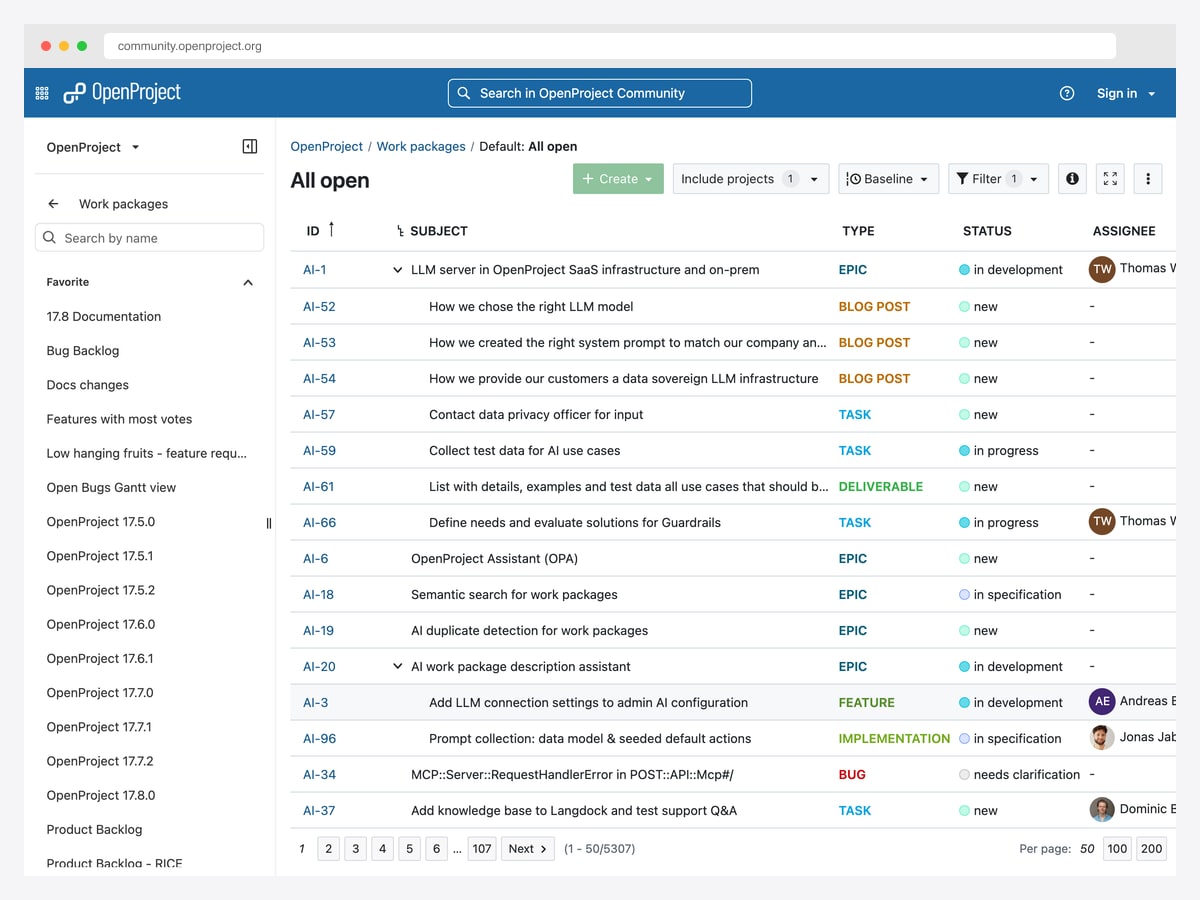
Why it is worth studying: It is the only example here you can inspect at real scale — a live instance with thousands of work packages, not a seeded demo.
OpenProject runs its own development on a public instance, so the screenshot above is a genuine backlog rather than sample data: thousands of work packages, real assignees, and the mess that comes with actual use. That makes it the most honest reference in this list for how a table view behaves once it is full.
The type column is doing the heavy lifting. Epic, task, bug, feature, deliverable, and implementation each get a coloured label, so scanning tells you what kind of work each row represents before you read the subject. Hierarchy is shown by indentation with expand arrows, keeping parents and children in one table instead of separate views.
Note also what a mature tool keeps visible: filters, a baseline comparison, and the record count with pagination. When a view can return five thousand rows, telling the user how many there are and where they are in them is not a detail.
4. Asana — Show work as a connected flow
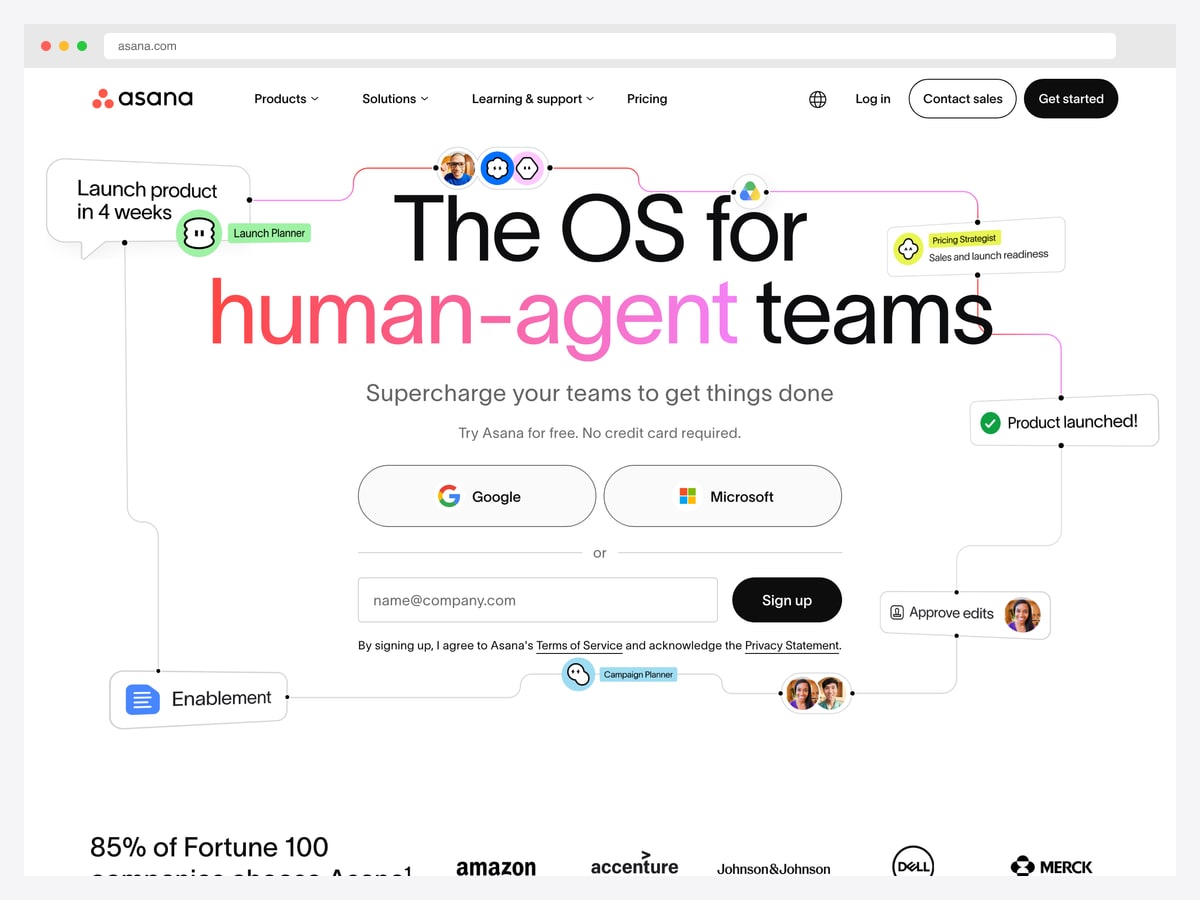
Why it is worth studying: It presents work as connected nodes rather than a list, which is how cross-functional work actually behaves — and how few tools draw it.
Asana’s product imagery renders work as a graph: a launch planner connected to a campaign planner, an approval step, and the people attached to each. Whatever you think of the marketing framing, the underlying idea is right — cross-team work is a dependency network, and a flat list cannot show that a design review blocks three downstream tasks.
Most project tools bury dependencies inside an item’s detail panel, where they are invisible until you go looking. Surfacing them as a visible structure — a timeline, a graph, or a Gantt view — is what turns “here are your tasks” into “here is why this is late”.
The caveat for anyone borrowing this: dependency visualisations degrade badly with volume. They are excellent for a launch of thirty items and unreadable at three hundred, which is why the tools that offer them also keep a plain list view one click away.
5. Shadcn UI Kit — Project Dashboard — The reporting view, kept honest
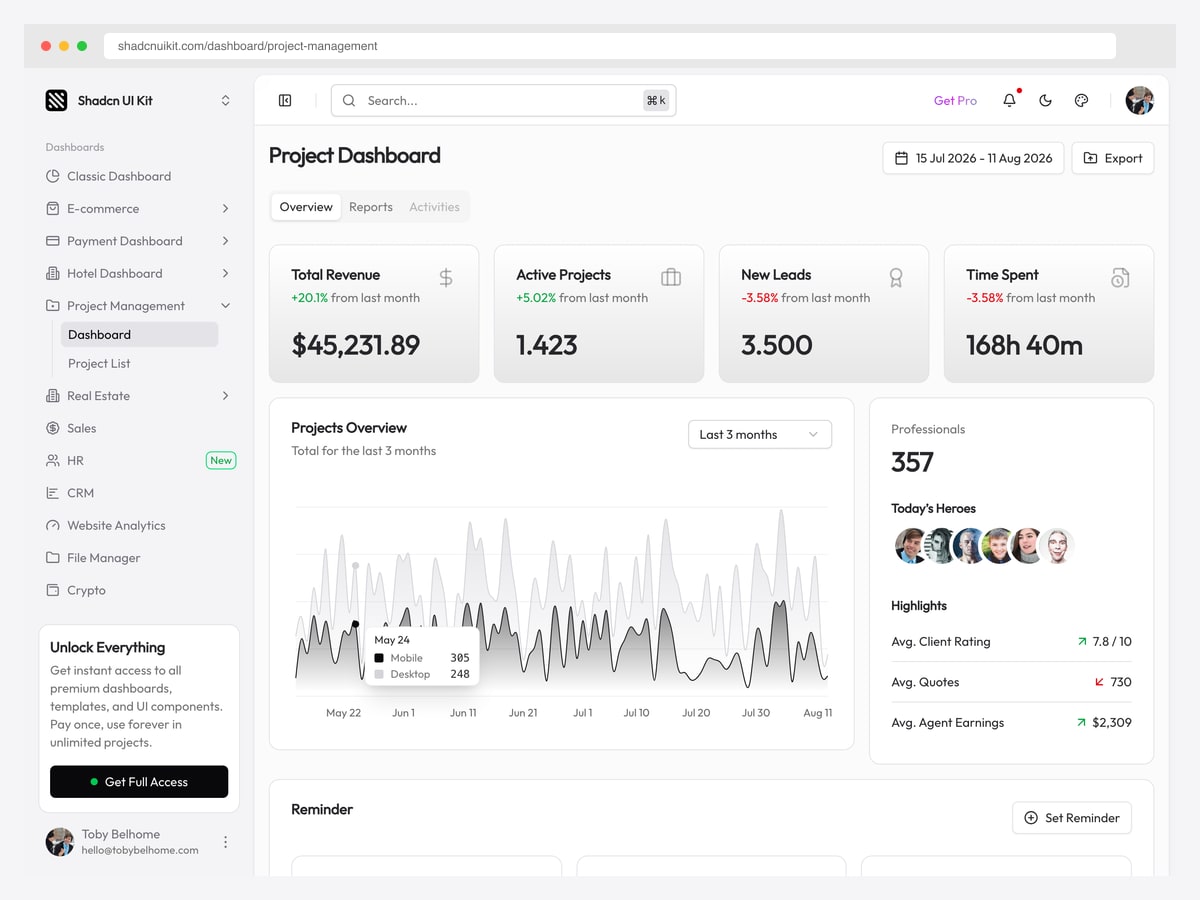
Why it is worth studying: A clean take on the manager-facing view — and a useful reminder that project dashboards and project tools are different products.
This is the screen a delivery lead wants rather than the one a contributor uses: revenue, active project count, new leads, and time spent, above a projects-overview chart and a team panel. Nobody completes a task here; the view exists to answer “how are we doing”.
Time spent is the metric worth noticing. Project dashboards that track only task counts miss that ten small tasks and one large one are not comparable, and effort is what actually forecasts delivery. Pairing a count with time is what makes the numbers mean something.
The template is free and openable, which makes it a practical reference. Treat the values as placeholders — as with most template demos, several are obviously synthetic.
6. Admindek Project (DashboardPack) — Separate the three task states that matter
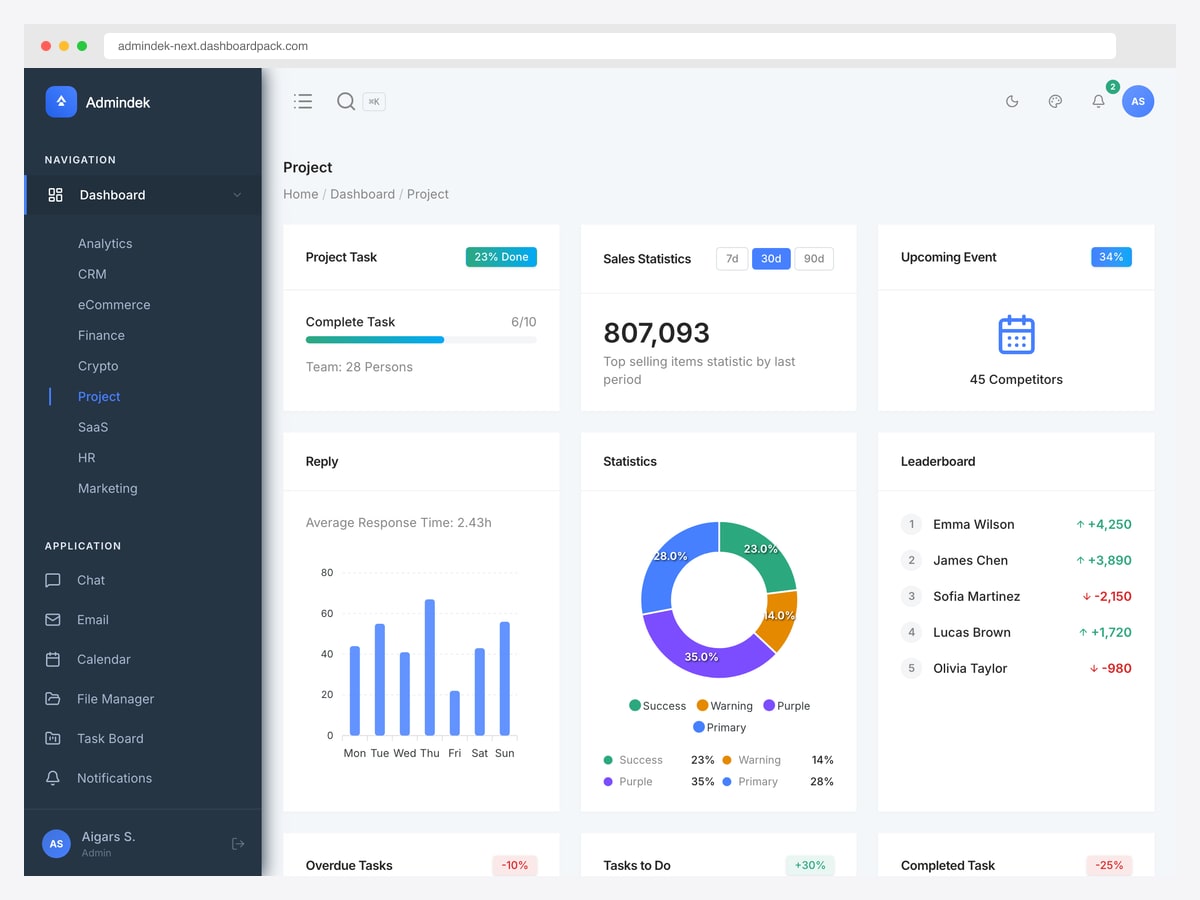
Why it is worth studying: It splits tasks into overdue, to-do, and completed as separate tiles rather than one completion percentage — the split a manager actually acts on.
The layout leads with task completion against a target and the team size, then adds response time, a status donut, and a contributor leaderboard. The strongest decision is lower down: overdue, to-do, and completed tasks each get their own tile with a change indicator, instead of being averaged into a single “percent complete”.
That averaging is the most common failure in project dashboards. A project at seventy percent complete with a growing overdue pile is in trouble; one at seventy percent with nothing overdue is fine. The single number cannot distinguish them, and the three-tile split can.
The leaderboard is more debatable and worth flagging honestly. Ranking contributors by output suits some cultures and actively damages others — it rewards volume over difficulty. If you copy the pattern, rank teams or workstreams rather than individuals.
The patterns behind good project dashboard design
Decide whose screen it is
A contributor opens a project tool to see what is assigned to them and change its state. A manager opens it to judge whether the work will land. Those needs share almost no components: the first wants a filtered list and fast editing, the second wants trends, overdue counts, and effort. Linear’s “my issues” and the reporting templates above are different products, and trying to merge them produces a screen that is slow for one audience and shallow for the other.
Never average project health into one number
Percent complete is the most requested and least useful metric in the category. Split it: what is done, what is in progress, what is overdue, and what is blocked. A project at seventy percent with a growing overdue pile and one at seventy percent with none require opposite responses, and only the split can tell them apart.
Count tasks and effort together
Task counts silently assume every item is the same size. Ten trivial tickets and one two-week migration are not interchangeable, so a burndown by count can look healthy while the project slips. Showing time spent or estimated effort alongside the count, as the reporting template does, is what makes the trend predictive rather than decorative.
Make status changes cheap
Every project tool depends on people keeping item state current, and every one of them decays when updating state is tedious. Linear’s one-click property rail exists for that reason. If changing status takes a modal and a save, your data will be stale within a fortnight and every dashboard built on it becomes fiction.
Show dependencies structurally
Most tools hide dependencies inside an item’s detail view, where they are invisible until someone goes looking. Surfacing them — as a timeline, graph, or Gantt view — is what explains why something is late rather than just that it is. Keep a plain list one click away, since these visualisations become unreadable past a few dozen items.
Be careful what you rank
Contributor leaderboards appear in a lot of project templates, and they measure volume rather than difficulty. That rewards splitting work into small tickets and penalises whoever takes the hard problem. If you want a ranking, rank teams or workstreams; if you want individual visibility, show contribution without ordering it competitively.
How to apply these patterns to your own build
The hard parts of a project dashboard are domain-shaped rather than visual: hierarchy between epics, tasks, and subtasks; dependency modelling; effort tracking; and status workflows that differ per team. A generic admin theme gives you none of them, which is why starting from a project-specific template usually saves more than it costs.
Two of the examples above are directly openable — the Shadcn UI Kit project dashboard is the free one to inspect first, and Admindek’s project view covers the task-health side. OpenProject is worth running locally if you want to study a mature work-item model rather than build one from scratch.
For the full set of buildable options, see our project management dashboard templates roundup. Whatever you start from, test the views with a realistically messy backlog early — layouts that look balanced against twenty seeded tasks fall apart against a real project with four hundred items, half of them overdue.
Project management dashboard design FAQ
What should a project management dashboard show?
For a manager: tasks split into done, in progress, overdue, and blocked rather than a single completion percentage; effort or time spent alongside task counts; and a trend over time. For a contributor: a filtered view of their own work with fast, one-click status changes. Those are different screens, and trying to serve both from one usually serves neither well.
Why is percent complete a bad project metric?
Because it averages away everything worth knowing. A project at seventy percent with a growing overdue pile is in trouble; one at seventy percent with nothing overdue is fine, and the single number cannot distinguish them. It also assumes every task is the same size, so completing ten trivial tickets can look like more progress than finishing one hard migration.
What is the difference between a project dashboard and a project management tool?
A project management tool is where the work happens — creating items, assigning them, changing status. A project dashboard is a reporting layer over that work, answering whether the project will land. Most products contain both, but they are separate screens with separate audiences, and the design decisions that make one good make the other worse.
Should a project dashboard include a contributor leaderboard?
Usually not, and it is worth resisting even though many templates ship one. Leaderboards measure volume rather than difficulty, which rewards splitting work into small tickets and penalises whoever takes the hardest problem. If you need a ranking, rank teams or workstreams rather than individuals.
How should task hierarchy be displayed?
In the same table, using indentation and expand arrows, rather than in a separate subtask panel — that keeps parents and children readable as one block. Pair it with a colour-coded type column (epic, task, bug, feature) so people can scan what kind of work each row is before reading the subject, which is what OpenProject does at scale.
Where can I find project management dashboard templates?
Our project management dashboard templates roundup covers the buildable options. The free Shadcn UI Kit project dashboard is the quickest to open and inspect, and Admindek’s project view is the stronger reference for task-health tiles. Both can be opened as live demos before you commit.

You Might Also Like


