
Logistics Dashboard Design Examples: 5 Interfaces Worth Studying

Logistics dashboards fail in a specific way: they report volume beautifully and exceptions badly. Shipments in transit, vehicles on route, orders fulfilled — those numbers are easy to render and rarely tell an operator what to do next. The five examples below, two openable templates and three live platforms, are the ones that handle the harder half well.
One thing to say plainly up front, because it shaped this list: logistics vendors gate their interfaces harder than any other vertical we have looked at. Most of the big names publish stock photography of warehouses and lorries rather than product screens, and several demos are login-only. This is a shorter list than our other design roundups as a direct result — every example here shows genuine product UI, and the ones that only showed a hero video were left out rather than padded in.
If you are looking for something to build on rather than study, our logistics dashboard templates roundup covers the buildable options. For patterns outside this vertical, see dashboard templates and UI design examples and our ecommerce admin dashboard templates, which shares the order-and-inventory half of the problem.
The examples at a glance
- Show where the time goes, not just where the trucks are: Sneat — Logistics Dashboard
- Categorise your exceptions: Materio — Logistics Dashboard
- Put the shipment on a map and the problems next to it: Flexport
- Report cost per order, not just volume: ShipBob
- Design the dispatcher’s screen around assignment: Onfleet
5 logistics dashboard designs worth studying
Ordered from fleet operations through to fulfilment reporting. Each entry ends with the one pattern most worth taking into your own work.
1. Sneat — Logistics Dashboard — Show where the time goes, not just where the trucks are
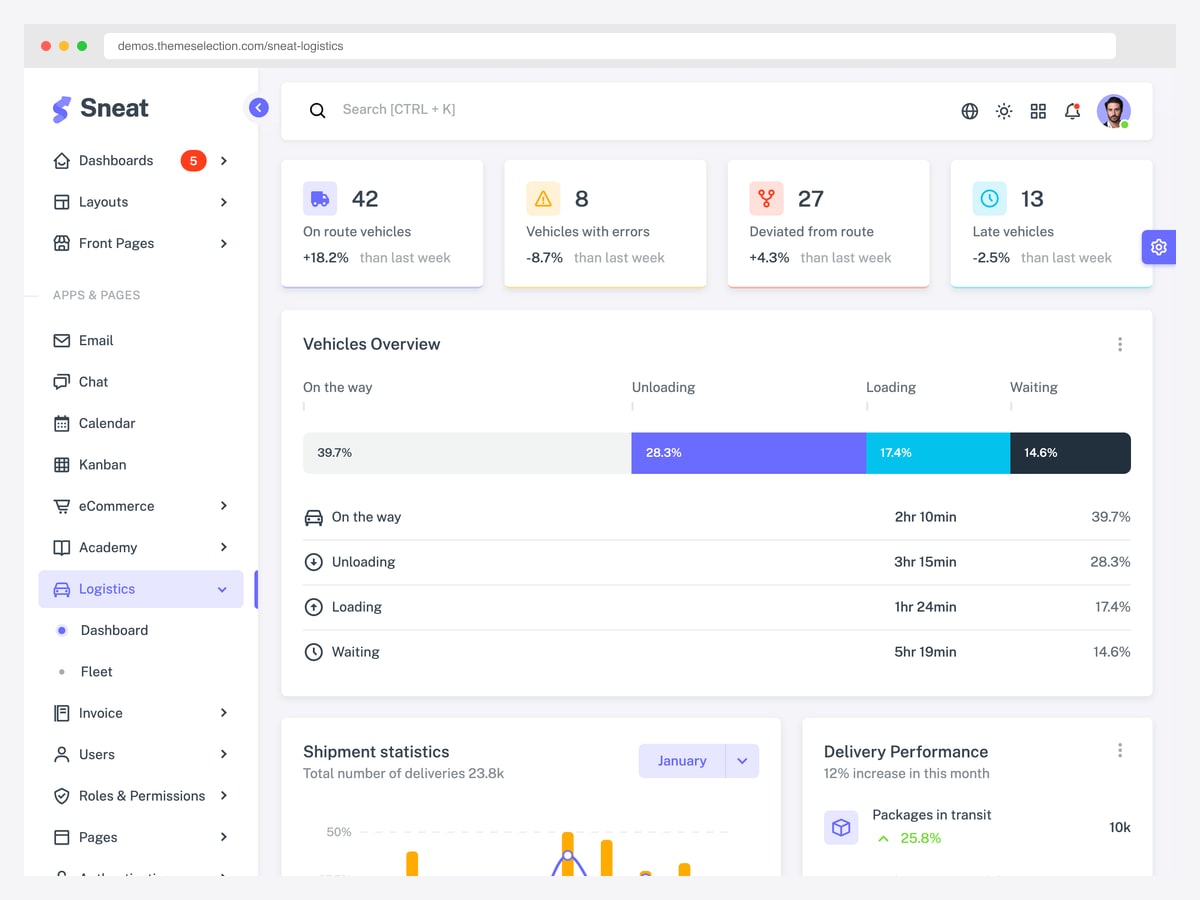
Why it is worth studying: Its vehicles overview breaks the fleet down by time spent in each state — moving, loading, unloading, waiting — which is the number that actually explains poor utilisation.
The top row counts vehicles by condition: on route, with an error, deviated from the route, and running late. Four counts, four different responses. That is a better opening than a single “fleet health” gauge, because each number maps to a person who has to do something about it — a deviation is a dispatcher problem, a mechanical error is a maintenance one.
The panel below it is the part worth copying. Instead of showing only how many vehicles are moving, it splits the fleet’s time across four states with both a percentage and an average duration: on the way, unloading, loading, and waiting. Waiting and loading time is where fleet utilisation quietly disappears, and a dashboard that only shows “on route” versus “idle” makes that invisible.
Two caveats before you plan around it. Sneat’s logistics screen is part of a general-purpose Bootstrap admin template rather than a dedicated logistics product, so the route-level data model behind it is yours to build — what you are buying is a sensible arrangement of it. And the logistics dashboard ships only in the paid Pro edition; the free version of Sneat does not include this page, though the Pro demo is open to view without an account.
2. Materio — Logistics Dashboard — Categorise your exceptions
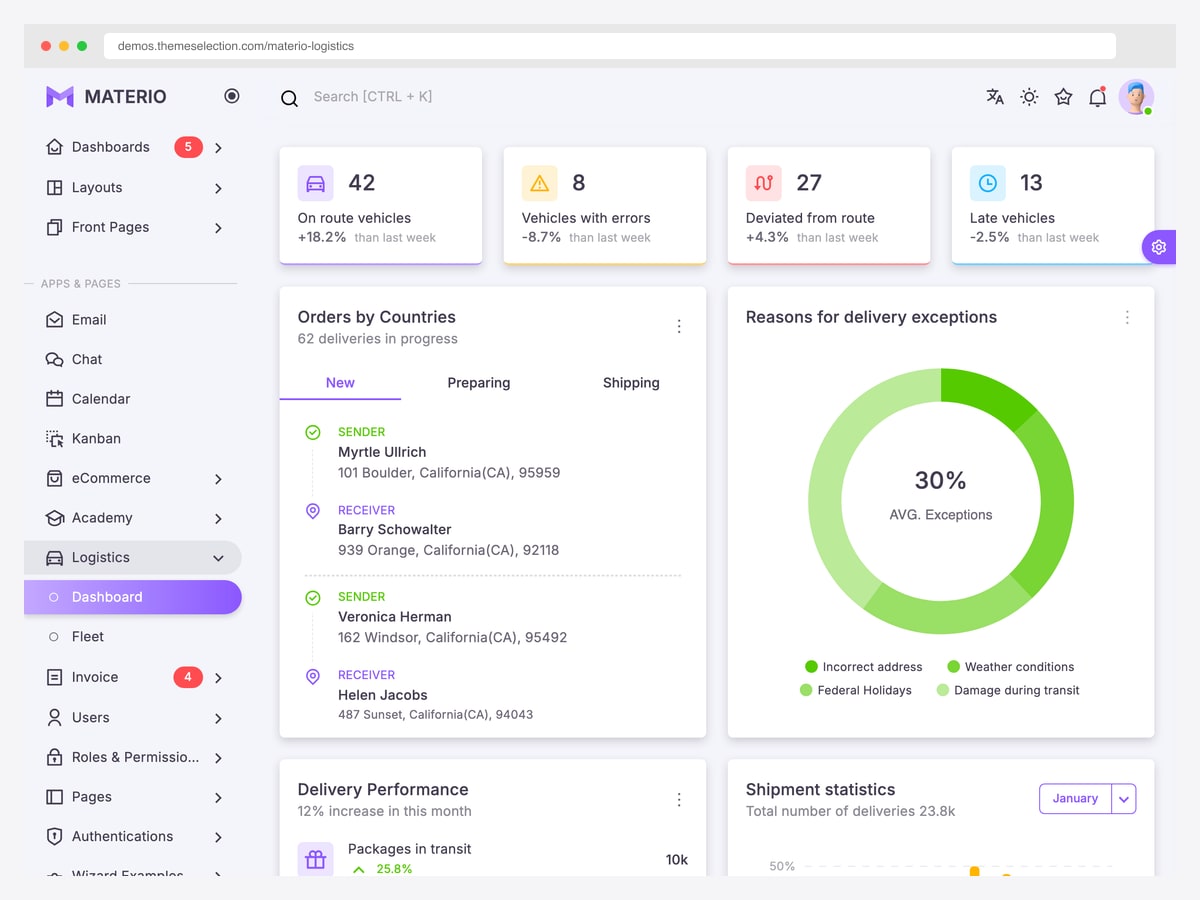
Why it is worth studying: It puts a “reasons for delivery exceptions” breakdown on the main screen — incorrect address, weather, holidays, damage in transit — which turns a failure count into a work list.
Materio shares the same fleet-status row as Sneat (both come from the same maintainer, so the resemblance is not a coincidence), but it spends the rest of the screen differently, and better. The standout panel categorises why deliveries failed: incorrect address, weather, federal holidays, and damage in transit.
That distinction is the whole point of the screen. “Forty-two exceptions today” is a number nobody can act on. “Twenty-six of them were bad addresses” is an address-validation project; “most were weather” is not your problem to fix but is your problem to communicate. Same total, completely different consequence, and only the categorised version tells you which one you are in.
The orders panel underneath tracks shipments by country with both sender and receiver addresses, tabbed by new, preparing, and shipping. Tabbing by pipeline stage rather than filtering by status is a small choice that keeps the most common views one click apart instead of three.
As with Sneat, the logistics screen is a Pro-edition page — Materio’s free MIT release does not include it — but the Pro demo can be opened and inspected without signing up.
3. Flexport — Put the shipment on a map and the problems next to it
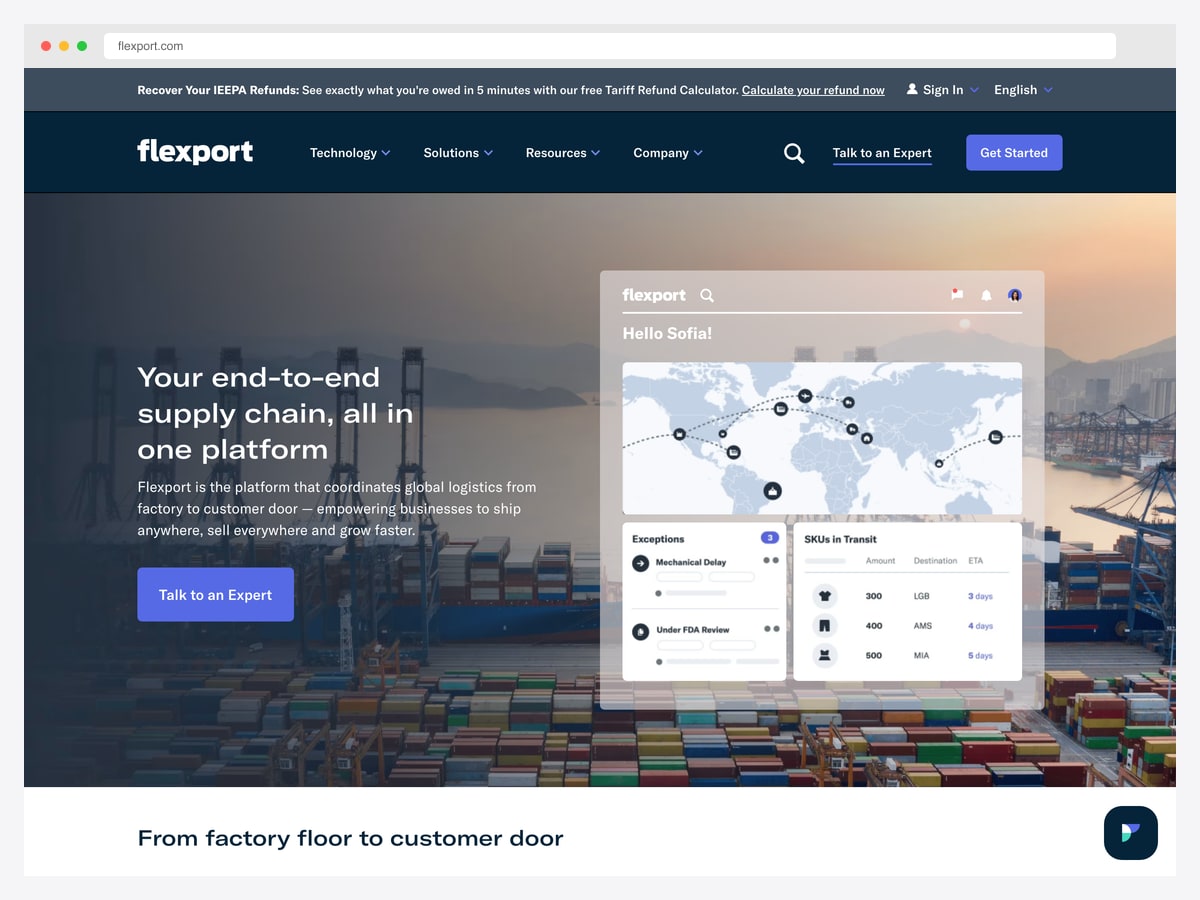
Why it is worth studying: It pairs a route map with a named exceptions list and an SKU-level in-transit table, so the overview and the detail sit on one screen.
Flexport’s product view draws active shipments as routes across a world map, which is the correct visualisation here for a reason that does not apply to most dashboards: in international freight, geography is the state. A container’s position on a route tells you more about its ETA than any status label, and a map communicates that instantly where a table cannot.
Beside the map sits an exceptions panel with specific, named causes — a mechanical delay on one shipment, another held under FDA review. Naming them matters. Regulatory holds, mechanical failures, and customs delays have different owners and different resolution paths, and a generic “delayed” badge collapses all three into one useless state.
The SKUs-in-transit table is the third layer: what is actually inside those shipments, where it is going, and when it lands. Freight software that stops at the container level forces the merchandiser to translate it into stock, and translating between shipment and SKU is where planning errors come from.
4. ShipBob — Report cost per order, not just volume
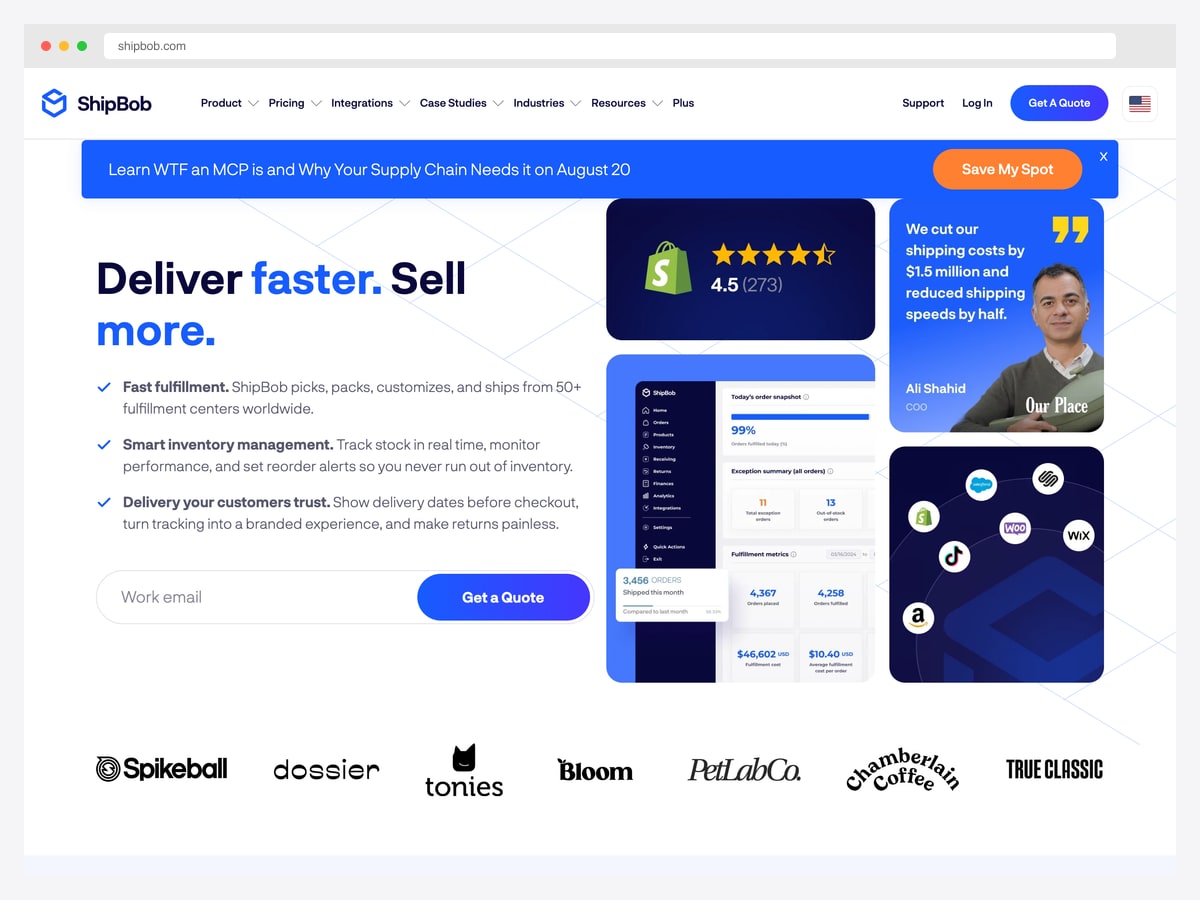
Why it is worth studying: Its fulfilment metrics show average cost per order alongside the volume counts — the ratio that tells a merchant whether growth is actually profitable.
The dashboard opens with a daily snapshot — orders fulfilled today as a percentage — then an exception summary that separates total exception orders from out-of-stock orders. Those are two different problems: an exception is something that went wrong in processing, a stockout is a demand-planning miss, and merging them into one alert count would obscure both.
The metrics block is where the design earns its place here. Orders shipped this month, orders placed, and orders fulfilled sit alongside total fulfilment cost and average cost per order. Most logistics dashboards report only volume, which is the number that always goes up and rarely answers the question the business is asking. Cost per order is the ratio that reveals whether scale is working.
It is also a good example of the reporting-period choice. “Today” for operational tiles and “this month” for financial ones is not inconsistency — it reflects that a fulfilment miss is a today problem while cost efficiency is only readable over weeks.
5. Onfleet — Design the dispatcher’s screen around assignment
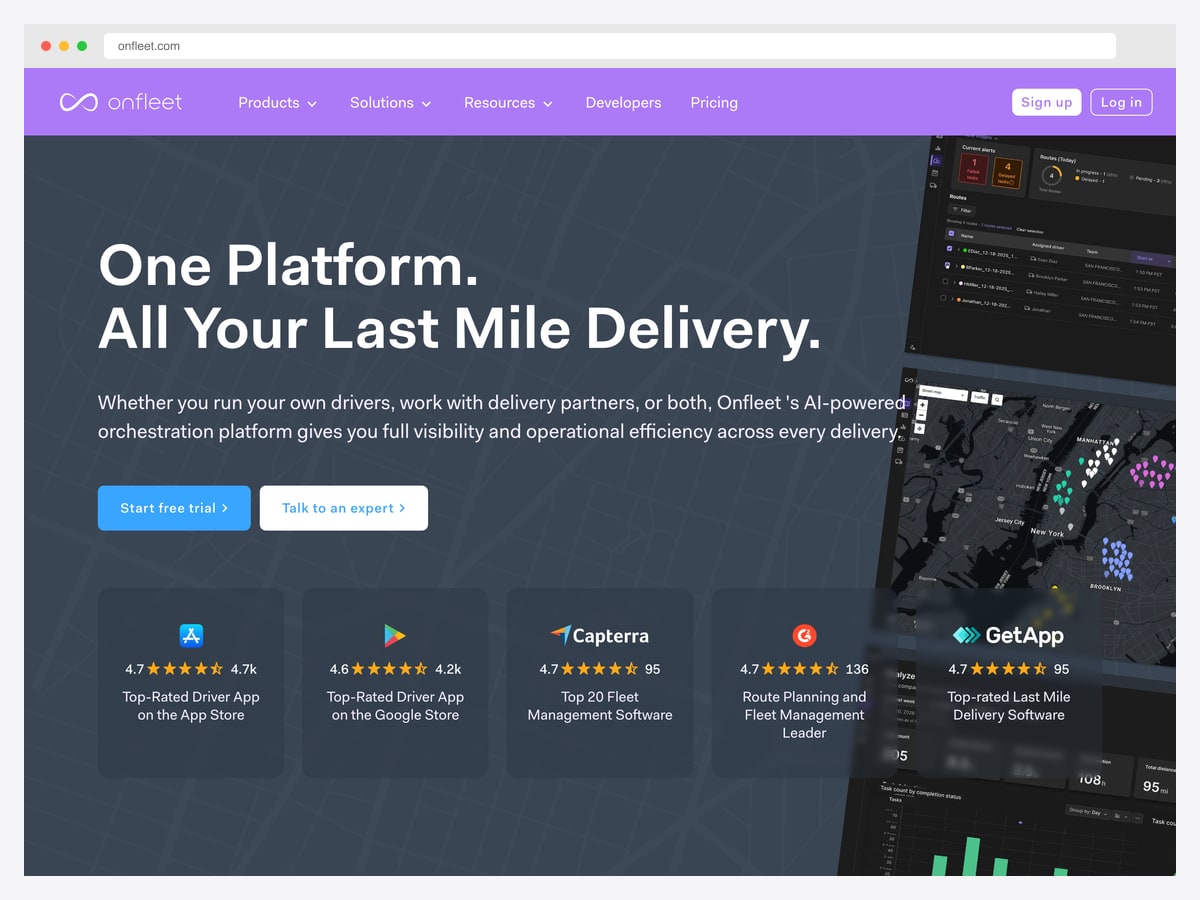
Why it is worth studying: It builds the last-mile workflow around a route list next to a live map, with assignment as the primary action rather than a buried setting.
Onfleet’s product view puts a list of routes and their assigned drivers immediately beside a live delivery map. That pairing is the last-mile equivalent of a task list next to a calendar: the list is what you edit, the map is how you verify the edit made sense, and separating them into different screens breaks the loop.
Last-mile is the segment where the operator’s job is continuous reassignment — a driver runs late, a delivery fails, a new order arrives inside an existing route. The interface reflects that by making assignment a first-class action on the list rather than a property hidden inside a delivery’s detail view. A screen that requires three clicks to move a stop between drivers will not be used during a busy shift.
The analytics panel is deliberately secondary. In dispatch tools, reporting is a different session from operating, and giving it equal prominence on the operational screen would push the live work below the fold.
The patterns behind good logistics dashboard design
Exceptions are the product
Every example that earned its place here does the same thing: it treats failures as a first-class category with named causes, not as a red badge on an otherwise green screen. In logistics the happy path needs almost no interface — a shipment that arrives on time requires no decision from anyone. The entire operational value of the dashboard lives in the small percentage that went wrong, which is exactly the part most designs compress into a single count.
Categorise by who fixes it
Materio’s exception donut and Flexport’s named holds both work because their categories map to owners. Incorrect address is an address-validation problem; weather is a customer-communication problem; damage in transit is a carrier-claims problem; a regulatory hold is a compliance problem. If a category does not change who picks up the phone, it is decoration.
Pair every volume metric with a ratio
Orders shipped, shipments in transit, and vehicles on route all trend upward with the business and therefore say almost nothing about whether it is working. ShipBob’s cost per order is the corrective: the same volume at a rising unit cost is a very different business than the same volume at a falling one, and only the ratio can distinguish them. On-time percentage, cost per delivery, and vehicle utilisation are the equivalents on the fleet side.
Use a map only where geography is the state
Maps are the most over-used component in this vertical and one of the few places they are genuinely right. In freight and last-mile, position is status — a container’s location on a route predicts its ETA better than any workflow label. But a map is a poor way to answer “how many are late”, so pair it with a list or table that can be sorted, filtered, and counted. Flexport and Onfleet both do; a map on its own is a screensaver.
Measure time in state, not just current state
Sneat’s vehicles panel is the clearest example: knowing that thirty-nine percent of the fleet is moving is much less useful than knowing the fleet spends an average of two hours ten minutes in that state and another chunk waiting. Utilisation problems live in the transitions — loading, unloading, waiting at a dock — and a dashboard that only reports the current state can never surface them.
Match the reporting period to the decision
Fulfilment rate is a today number; cost per order is a monthly one. Mixing periods on the same screen looks inconsistent and is actually correct, provided each tile labels its window clearly. The failure mode is the opposite — forcing everything to one period, which makes operational tiles too slow to act on and financial ones too noisy to read.
How to apply these patterns to your own build
The difficult parts of a logistics dashboard are not visual. Route and shipment state modelling, carrier integrations, exception taxonomies, and address validation are all domain work that a generic admin theme gives you nothing for — which is why starting from a logistics-specific layout tends to save less time than people expect. What a template does buy you is a sensible arrangement of screens you would otherwise design from scratch.
Two of the examples above can be opened and clicked through without an account: the Sneat and Materio logistics dashboards. Both are Pro-edition pages — neither maintainer includes the logistics screen in their free release — but the demos are public, which is enough for studying the layout before you decide whether to buy. They also come from the same maintainer, so choosing between them is a visual decision, Bootstrap versus Material Design, rather than a technical one.
For the full set of buildable options across frameworks, see our logistics dashboard templates roundup. Whatever you start from, populate it early with a realistically bad day: a handful of deviated vehicles, a stockout, and a weather event. Layouts that look calm against clean demo data are exactly the ones that fall apart when an operator needs them most.
Logistics dashboard design FAQ
What should a logistics dashboard show?
Shipment or fleet status split by condition rather than a single health score, exceptions categorised by cause, and at least one ratio — cost per order, on-time percentage, or vehicle utilisation — alongside the volume counts. Volume alone rises with the business and cannot tell you whether operations are improving.
Why categorise delivery exceptions by cause?
Because the cause determines the owner. An incorrect address is an address-validation fix, weather is a customer-communication task, damage in transit is a carrier claim, and a regulatory hold is a compliance issue. A single “42 exceptions” count tells you something is wrong; the breakdown tells you which four people need to act, which is why Materio puts that donut on the main screen.
Should a logistics dashboard include a map?
Only where geographic position is genuinely the status — international freight and last-mile delivery both qualify, since a shipment’s location predicts its arrival better than any workflow label. Always pair it with a sortable list or table, because a map cannot answer “how many are late” or “which of these needs me first”.
What is the difference between fleet and fulfilment dashboards?
A fleet dashboard tracks vehicles and routes — where assets are, what state they are in, and how their time is spent. A fulfilment dashboard tracks orders and inventory through a warehouse — what shipped, what is short, and what it cost. They share an exception-handling mindset but almost no metrics, and trying to build one screen for both usually produces a weak version of each.
How should vehicle utilisation be measured?
By time in each state rather than by a moving-versus-idle split. Sneat’s vehicles overview breaks the fleet into on the way, unloading, loading, and waiting, each with a percentage and an average duration. Utilisation is normally lost in loading and waiting time, and a dashboard that only reports how many vehicles are on route makes that loss invisible.
Where can I find logistics dashboard templates?
Our logistics dashboard templates roundup covers the buildable options across frameworks. Sneat and Materio both ship a dedicated logistics dashboard, though only in their paid Pro editions — the free releases of each do not include that page. Their demos are public, so you can inspect the layout in full before deciding whether it is worth the licence.

You Might Also Like


