10 Best Developer & DevOps Dashboard Templates (2026)
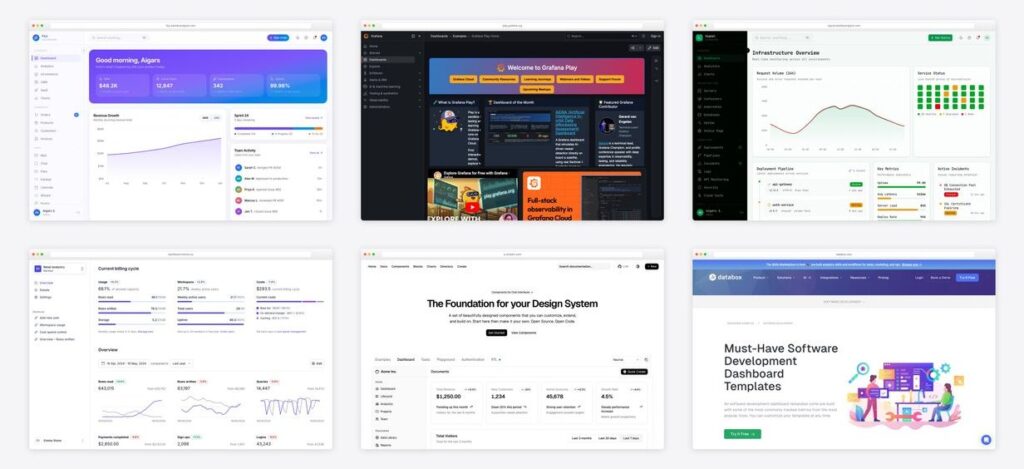
“Developer dashboard” means four different things — code templates for your product’s UI, engineering-metrics dashboards, no-code BI boards, and Figma design files — and most roundups only cover one. Here are the 10 best developer and DevOps dashboard templates and tools in 2026, organized by which of those you actually need, with every demo verified live.
Short on time? Flux is the template literally built around software-company screens, Grafana owns the engineering-metrics lane, and shadcn/ui is the own-your-code baseline.
Quick Picks
- Built for software companies: Flux — roadmap, feature flags, deploy log pages
- Engineering/DevOps screens: Signal — service health, pipelines, incidents
- Most dashboard variants: Apex — 5 variants, 125+ pages, React + Tailwind
- Best free template: TailAdmin — free in HTML, React, Vue, or Angular
- Own your code: shadcn/ui Dashboard — copy-paste components, infinitely custom
- Usage & billing metrics: Tremor — the customer-facing usage page, free
- Production monitoring: Grafana — the standard, with a live playground
- Self-serve internal BI: Metabase — dashboards over your database, no code
- No-code KPI boards: Databox — prebuilt software-dev templates
- Design files: Figma templates — design the dashboard before building it
Which kind of developer dashboard do you need?
| You want… | Pick from | Skill needed |
|---|---|---|
| A dashboard UI inside your product | Flux, Apex, TailAdmin, shadcn/ui, Tremor | Frontend dev |
| Engineering / production monitoring | Grafana, Signal | DevOps-ish |
| Internal metrics without code | Metabase, Databox | None–SQL |
| Design mockups first | Figma templates | Design |
Dashboard templates for software products
1. Flux Dashboard
Built for software companies specifically
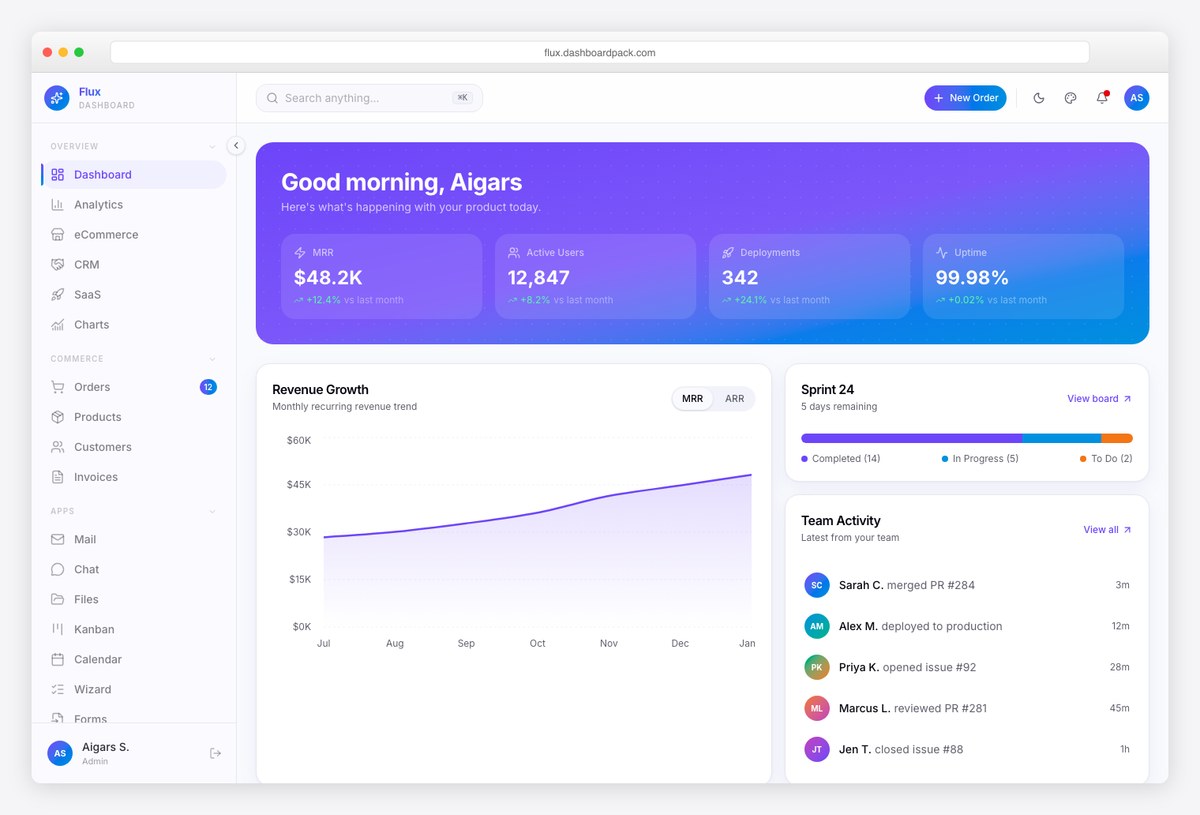
Why we like it: Flux is the rare template designed around a software company’s actual screens: product roadmap, feature flags, deployment log, and release views alongside the usual analytics — not another generic sales dashboard.
Most “dashboard templates” assume you sell widgets; Flux assumes you ship software. Its five dashboard variants and 60+ pages include the operational surfaces product and platform teams need — roadmaps, flags, deploy history — in a modern, animated design language.
Disclosure: Flux is our own DashboardPack product, which is exactly why its page list looks like this.
2. Signal
DevOps & engineering-metrics dashboard
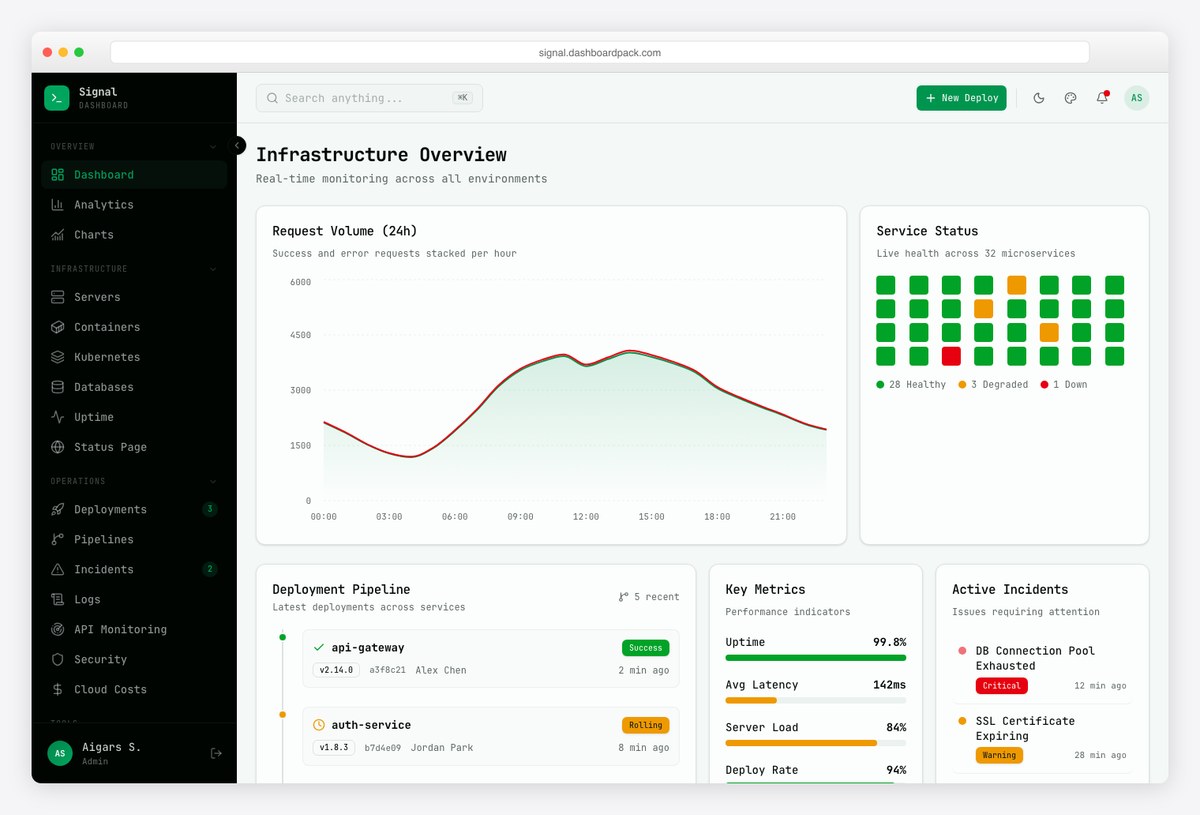
Why we like it: Signal covers the engineering side of a software org — service health, pipelines, incidents, infrastructure metrics — in a dark-first UI built for people who stare at it all day.
If the dashboard you need is closer to “how are our services doing” than “how are sales doing,” Signal’s DevOps-oriented screens map directly: monitors, deploy pipelines, alerting views, and log-style tables. It pairs naturally with real telemetry from your APM or Grafana stack.
Also ours — Flux for the product org, Signal for the platform org.
3. Apex Dashboard
The multi-variant workhorse
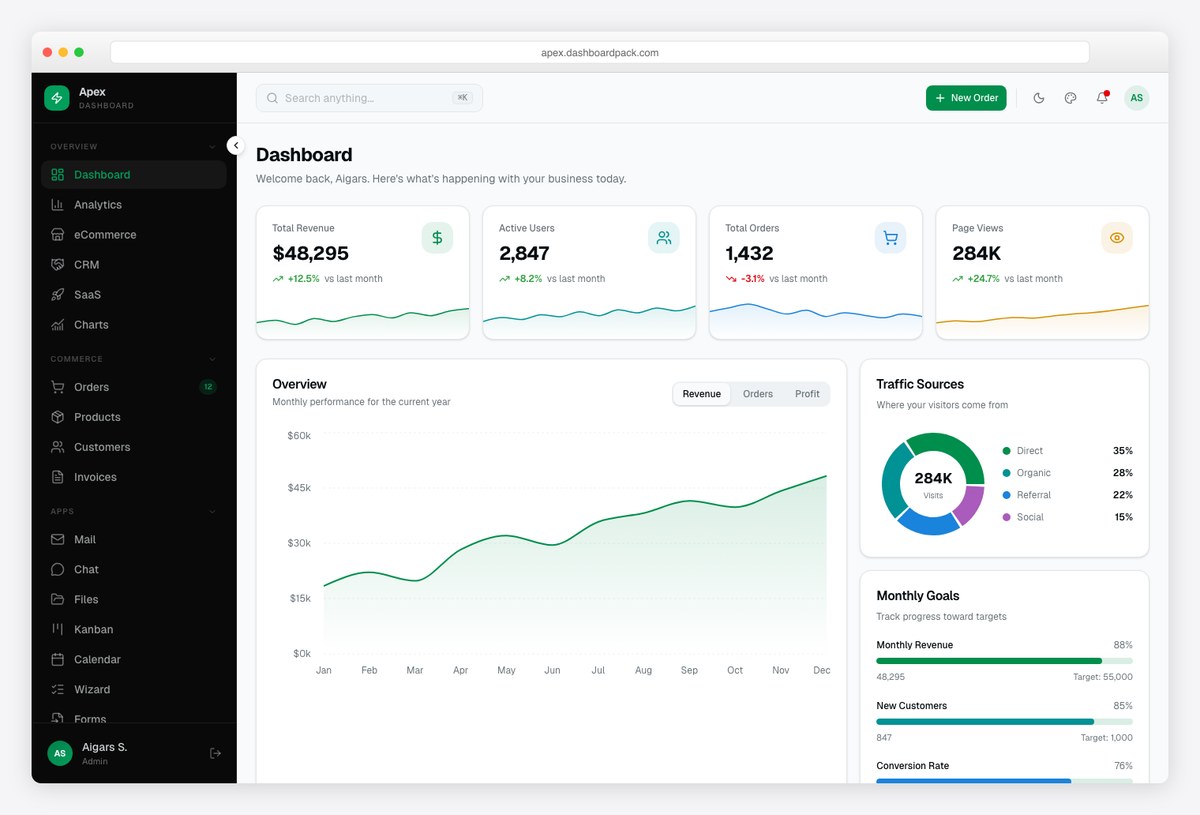
Why we like it: Apex ships five dashboard variants and 125+ pages on the modern React + Tailwind stack — a single purchase that covers the analytics, CRM-ish, and operational screens a growing software product accumulates.
Apex is the generalist of our line: SaaS metrics, e-commerce analytics, project views, and full CRUD pages in a shadcn-adjacent design. Teams use it as the interface layer over their own APIs when the product needs many dashboard types at once.
The third first-party entry — after this the list is all third-party, promise.
4. TailAdmin
The free multi-framework standard
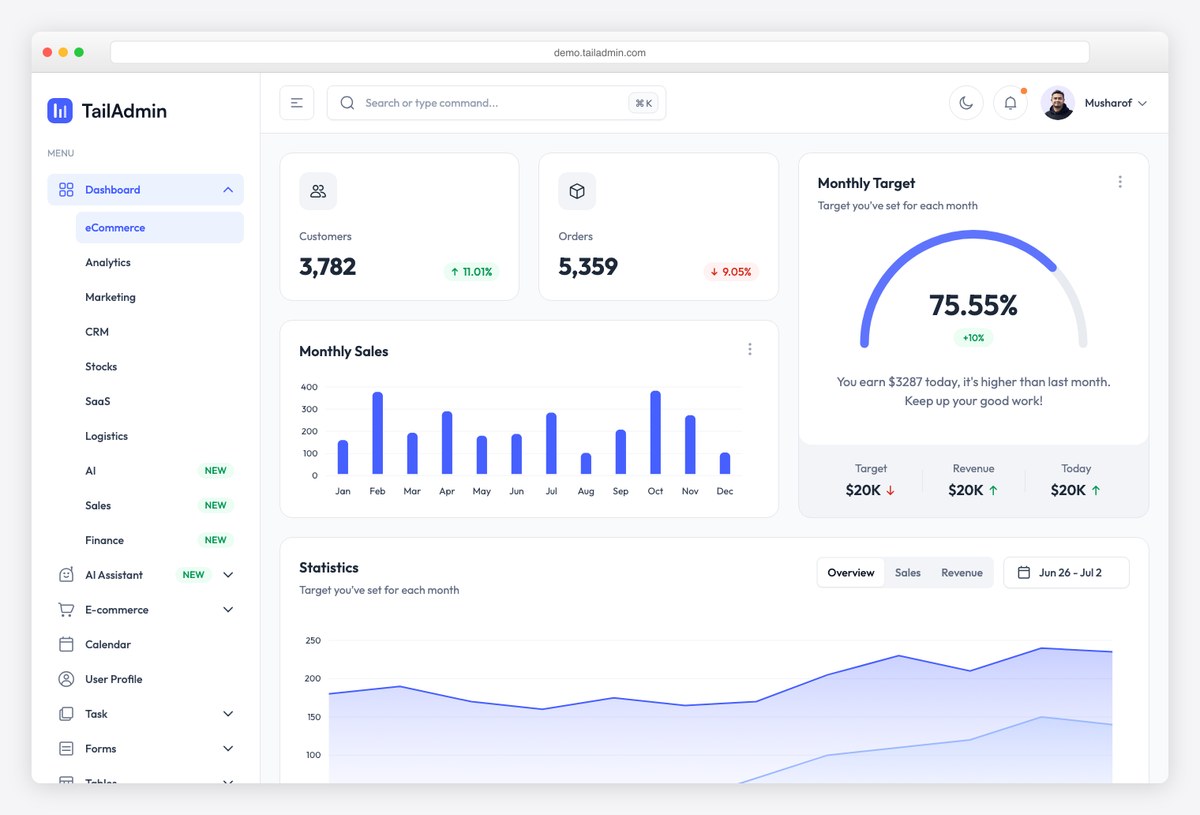
Why we like it: TailAdmin’s free tier gives a software team a working analytics dashboard in whichever framework they already use — HTML, React, Next.js, Vue, or Angular — with a Pro catalog behind it.
For a generic-but-good software dashboard on Tailwind, TailAdmin is the pragmatic free default: KPI cards, charts, tables, and auth pages, consistently maintained across an unusually wide framework matrix.
Start free, upgrade only if you need the app pages.
5. shadcn/ui Dashboard
Own-your-code dashboard baseline
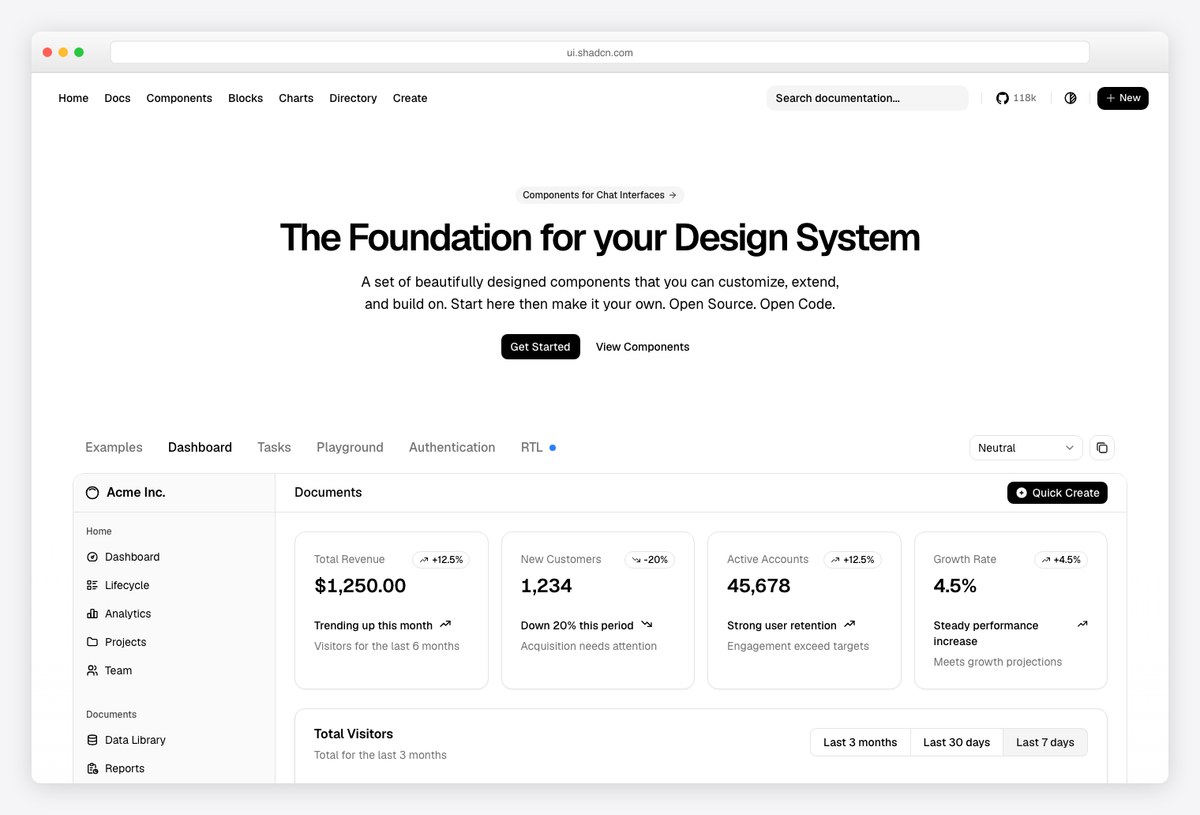
Why we like it: The shadcn/ui dashboard example plus its blocks are the modern way to assemble a bespoke software dashboard — copy the components into your codebase and shape them to your product.
When none of the templates fit because your software is genuinely different, the shadcn route wins: cards, charts (Recharts-based), tables, and sidebar blocks that become your code. Most new SaaS dashboards in 2026 visibly start here.
See our full shadcn/ui cluster for kits built on top of it.
6. Tremor Dashboard Template
Usage & billing metrics, solved
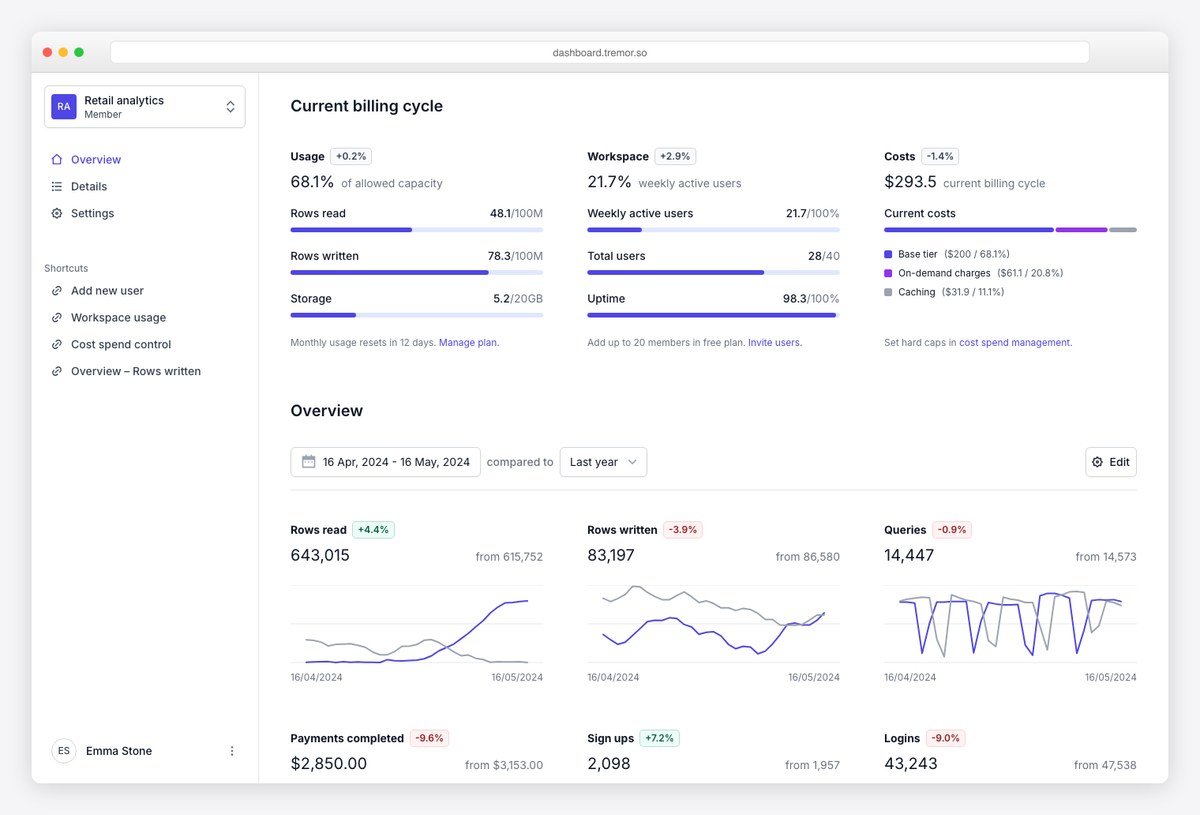
Why we like it: Tremor’s free dashboard template maps almost one-to-one onto a software product’s usage screens — consumption meters, billing-cycle costs, workspace analytics — ready to fork.
Every software product eventually shows customers their usage; Tremor’s template (now fully free, like all Tremor Blocks) is that page done well. Pair it with your metering API and the “software dashboard” your customers see is mostly finished.
Covered in depth in our Tremor ecosystem guide.
Engineering-metrics & BI dashboards
7. Grafana
The engineering-dashboard standard — live
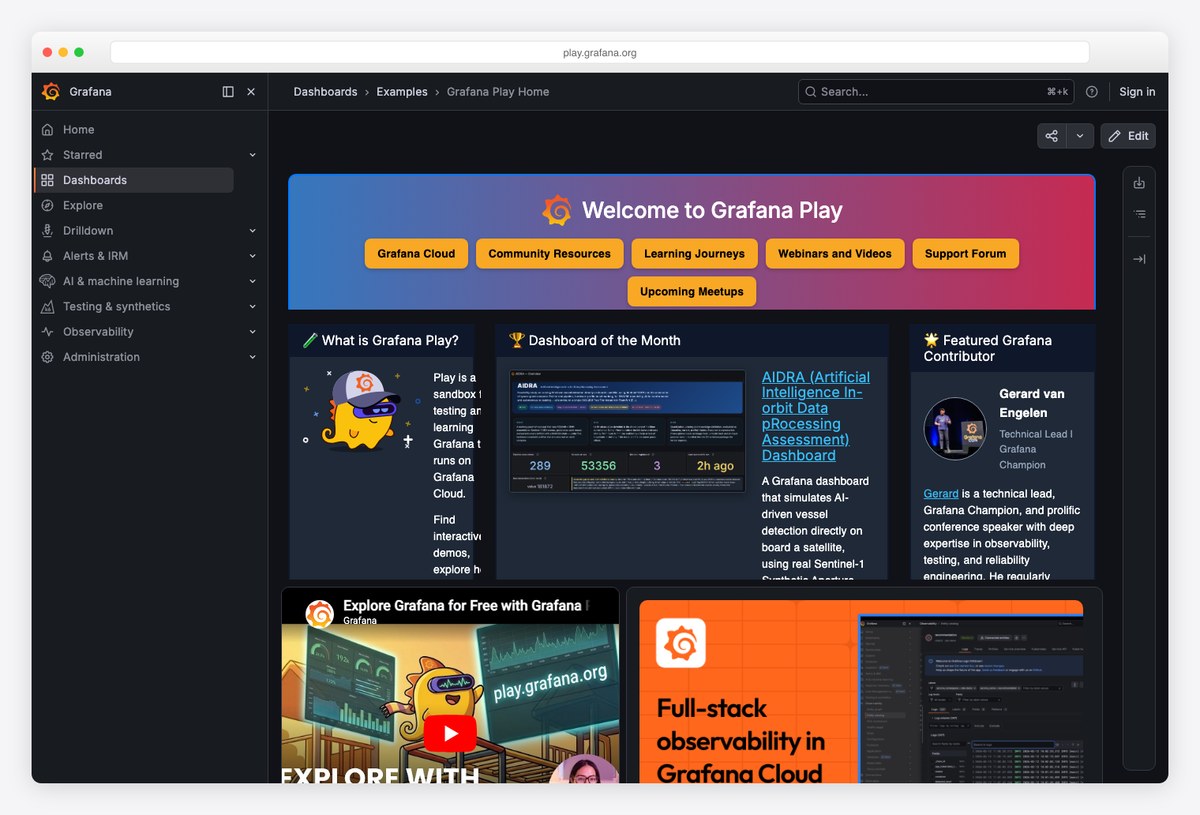
Why we like it: For engineering metrics — latency, error rates, infrastructure, business KPIs over time series — Grafana is the standard, and its public playground lets you study hundreds of real dashboards logged out.
If “software dashboard” means watching production, you don’t want a template, you want Grafana: dashboards-as-JSON over Prometheus/Loki/SQL, alerting, and a plugin ecosystem. The play.grafana.org instance (our screenshot) is a live catalog of dashboard patterns worth studying even if you build custom.
The engineering lane’s definitive answer.
8. Metabase
Open-source BI for product questions
Why we like it: Metabase turns your product database into shareable dashboards without code — the fastest route for a software team that wants internal metrics dashboards this week, self-hosted and free.
Point Metabase at Postgres, ask questions in its editor, pin the answers to dashboards: activation funnels, retention, revenue. It’s the open-source middle ground between hand-built template dashboards and enterprise BI.
Self-host the open-source edition or use their cloud.
9. Databox
Prebuilt software-development dashboards
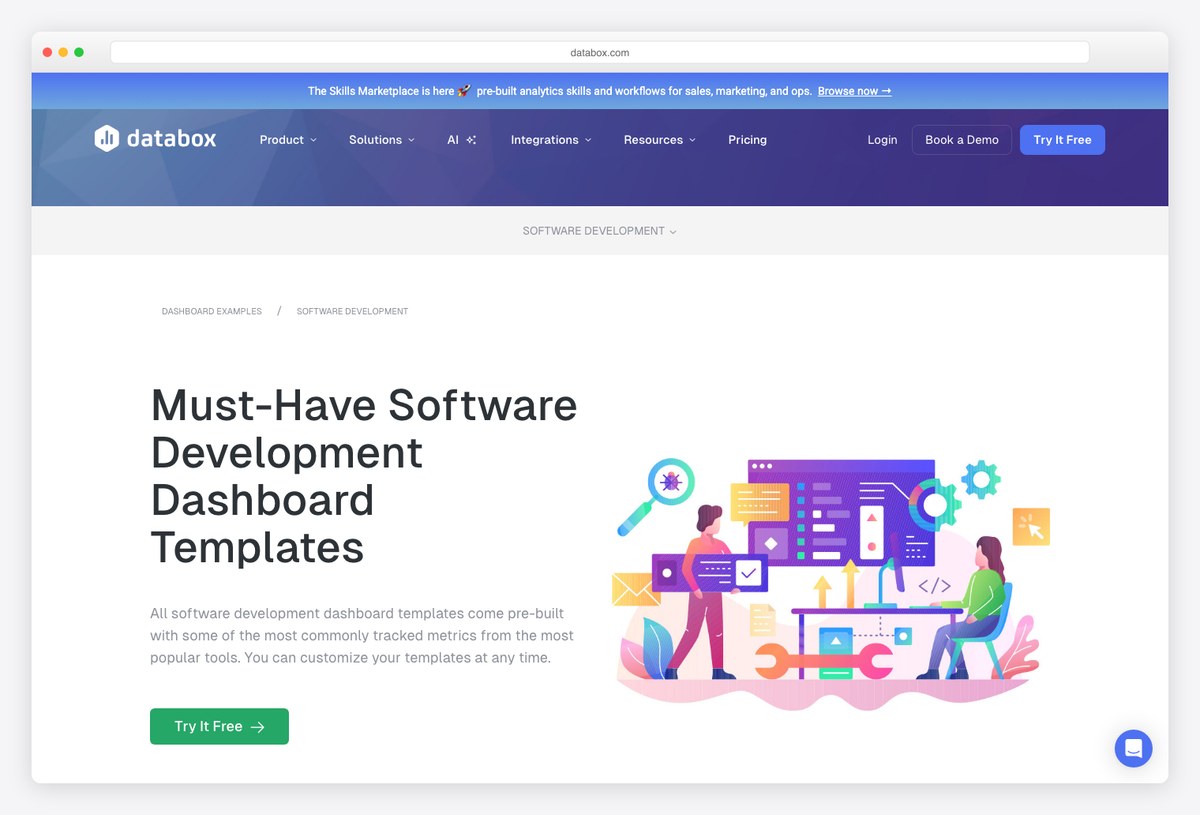
Why we like it: Databox ships ready dashboard templates for software development — sprint metrics, GitHub activity, support load — that fill from tool integrations rather than code.
For managers who want the dashboard without the build, Databox’s template gallery connects to GitHub, Jira, and the usual SaaS stack and renders opinionated KPI boards. It’s the “just show me the numbers” lane, priced freemium.
The right answer when nobody on the team should be writing dashboard code.
Design-file templates
10. Figma Dashboard Templates
The design-file lane
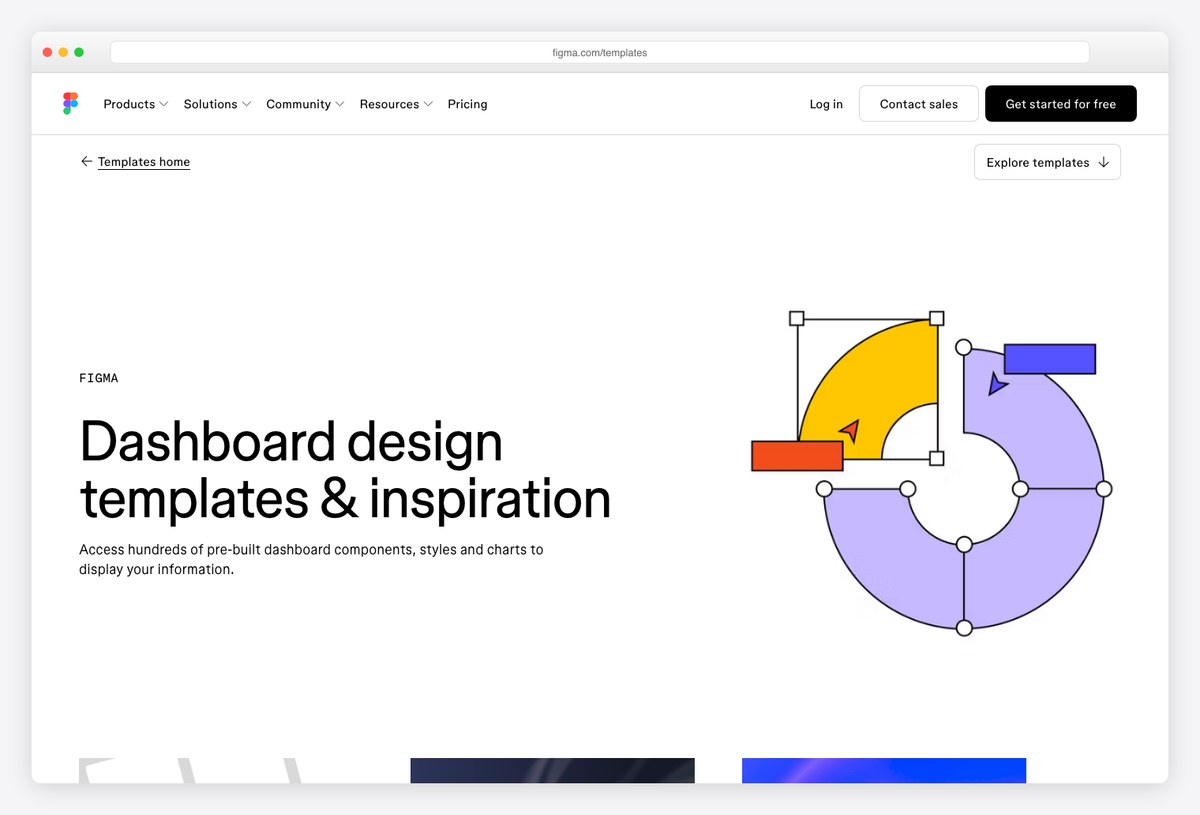
Why we like it: If you searched for design files rather than code, Figma’s dashboard template gallery is the canonical source — wireframes and full UI kits to design your software dashboard before a line is written.
Figma’s community templates cover SaaS, analytics, and vertical dashboards as editable design files. Designers start here, then hand off to any code template in this list — several entries above (TailAdmin, shadcn ecosystem) also publish matching Figma kits.
Included because a third of “software dashboard template” searches mean exactly this.
How to choose a developer dashboard template
- Customer-facing product dashboard? shadcn/ui for full control, Apex or TailAdmin for a head start, Tremor if it’s usage/billing metrics.
- Software-company back office? Flux — the roadmap/flags/deploys pages are already there.
- Watching production systems? Grafana; use Signal when you want that world’s UI patterns inside your own product.
- Internal KPIs for the team? Metabase self-hosted, Databox if it must be no-code with SaaS integrations.
- Still at the design stage? Figma’s gallery, then return here for the build.
Frequently asked questions
What is the best developer dashboard template?
Depends on the lane: for a dashboard inside your product, Flux (software-company screens) and TailAdmin (free, multi-framework) lead; for engineering metrics, Grafana is the standard; for no-code internal KPIs, Metabase (open source) or Databox (SaaS templates). The comparison table above maps all four senses of the query.
Is there a free developer dashboard template?
Several: TailAdmin’s free tier (HTML/React/Vue/Angular), the shadcn/ui dashboard example and blocks, Tremor’s now-free dashboard template for usage metrics, and both Grafana and Metabase are open source in their entirety.
What should a software product dashboard include?
For customers: usage against limits, billing status, key activity metrics, and API health. For the team: activation, retention, revenue, and engineering signals (deploys, errors, latency). Resist showing everything — our SaaS dashboard design guide covers the KPI-hierarchy rules.
Dashboard template or BI tool — which should we use?
Templates (code) win when the dashboard ships inside your product or must match your brand; BI tools (Metabase, Databox, Grafana) win for internal metrics where speed matters more than ownership. Many software teams run both: templates for the product UI, BI for the company.
Do these templates work with our existing backend?
Yes — the code templates here are frontend layers that consume your APIs (REST or GraphQL), and the BI tools connect directly to databases or SaaS integrations. None impose a backend; that’s what separates templates from platforms.
Going deeper? Browse the full dashboard templates collection, SaaS admin dashboards, and analytics dashboard templates — or study the design side in our SaaS dashboard design examples guide.

You Might Also Like